MaxScale 24.08 Beta Using MaxGUI Tutorial
Using MaxGUI Tutorial
Introduction
This tutorial is an overview of what the MaxGUI offers as an alternative solution to MaxCtrl.
Dashboard
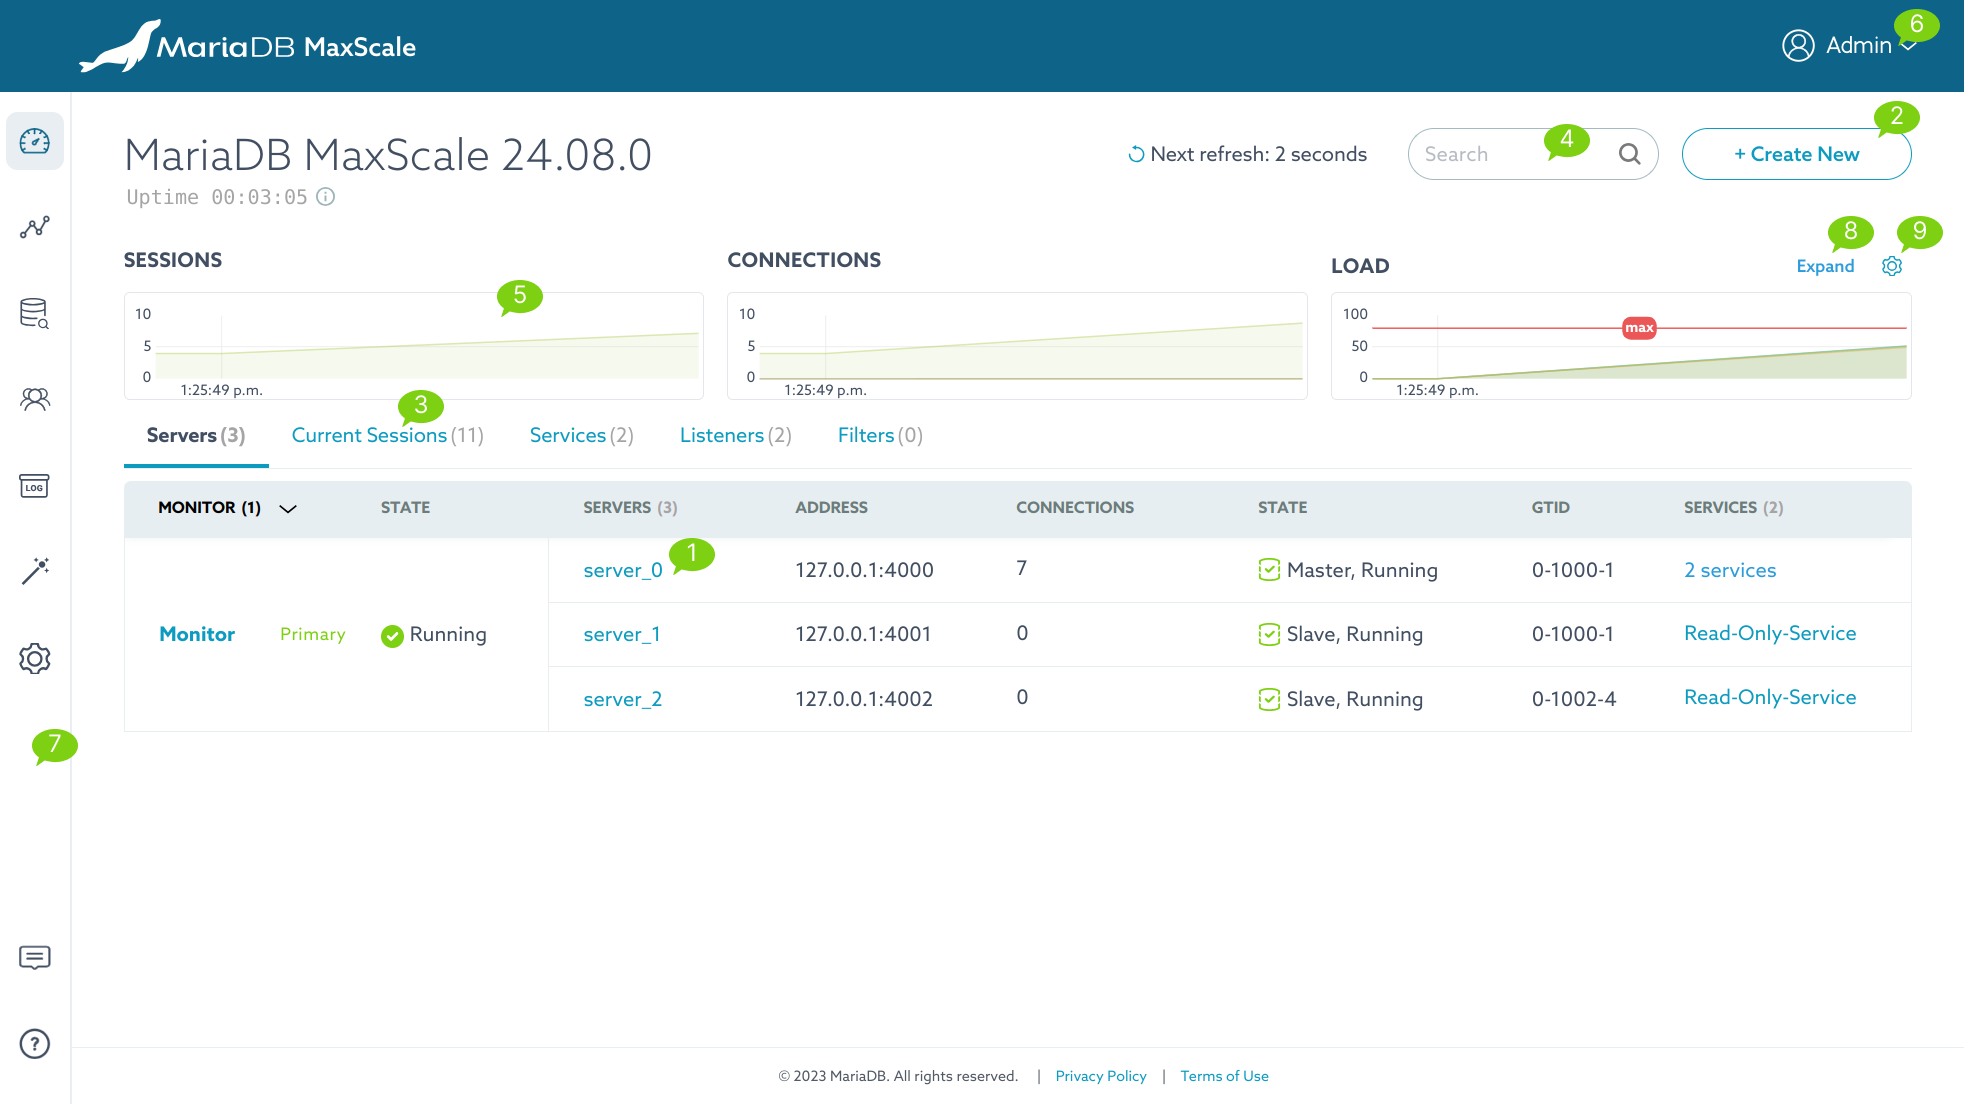
Annotation
- MaxScale object. i.e. Service, Server, Monitor, Filter, and Listener (Clicking on it will navigate to its detail page)
- Create a new MaxScale object.
- Dashboard Tab Navigation.
- Search Input. This can be used as a quick way to search for a keyword in tables.
- Dashboard graphs. Refresh interval is 10 seconds.
- SESSIONS graph illustrates the total number of current sessions.
- CONNECTIONS graph shows servers current connections.
- LOAD graph shows the last second load of thread.
- Logout of the app.
- Sidebar navigation menu. Access to the following pages: Dashboard, Visualization, Settings, Logs Archive, Query Editor
- Expand/Collapse the graphs
- Graph annotation configuration.
Create a new MaxScale object
Clicking on the Create New button (Annotation 2) to open a dialog for creating a new object.
View Replication Status
The replication status of a server monitored by MariaDB-Monitor can be viewed by mousing over the server name. A tooltip will be displayed with the following information: replication_state, seconds_behind_master, slave_io_running, slave_sql_running.
How to kill a session
A session can be killed easily on the "Current Sessions" list which can be found on the Dashboard, Server detail, and Service detail page.
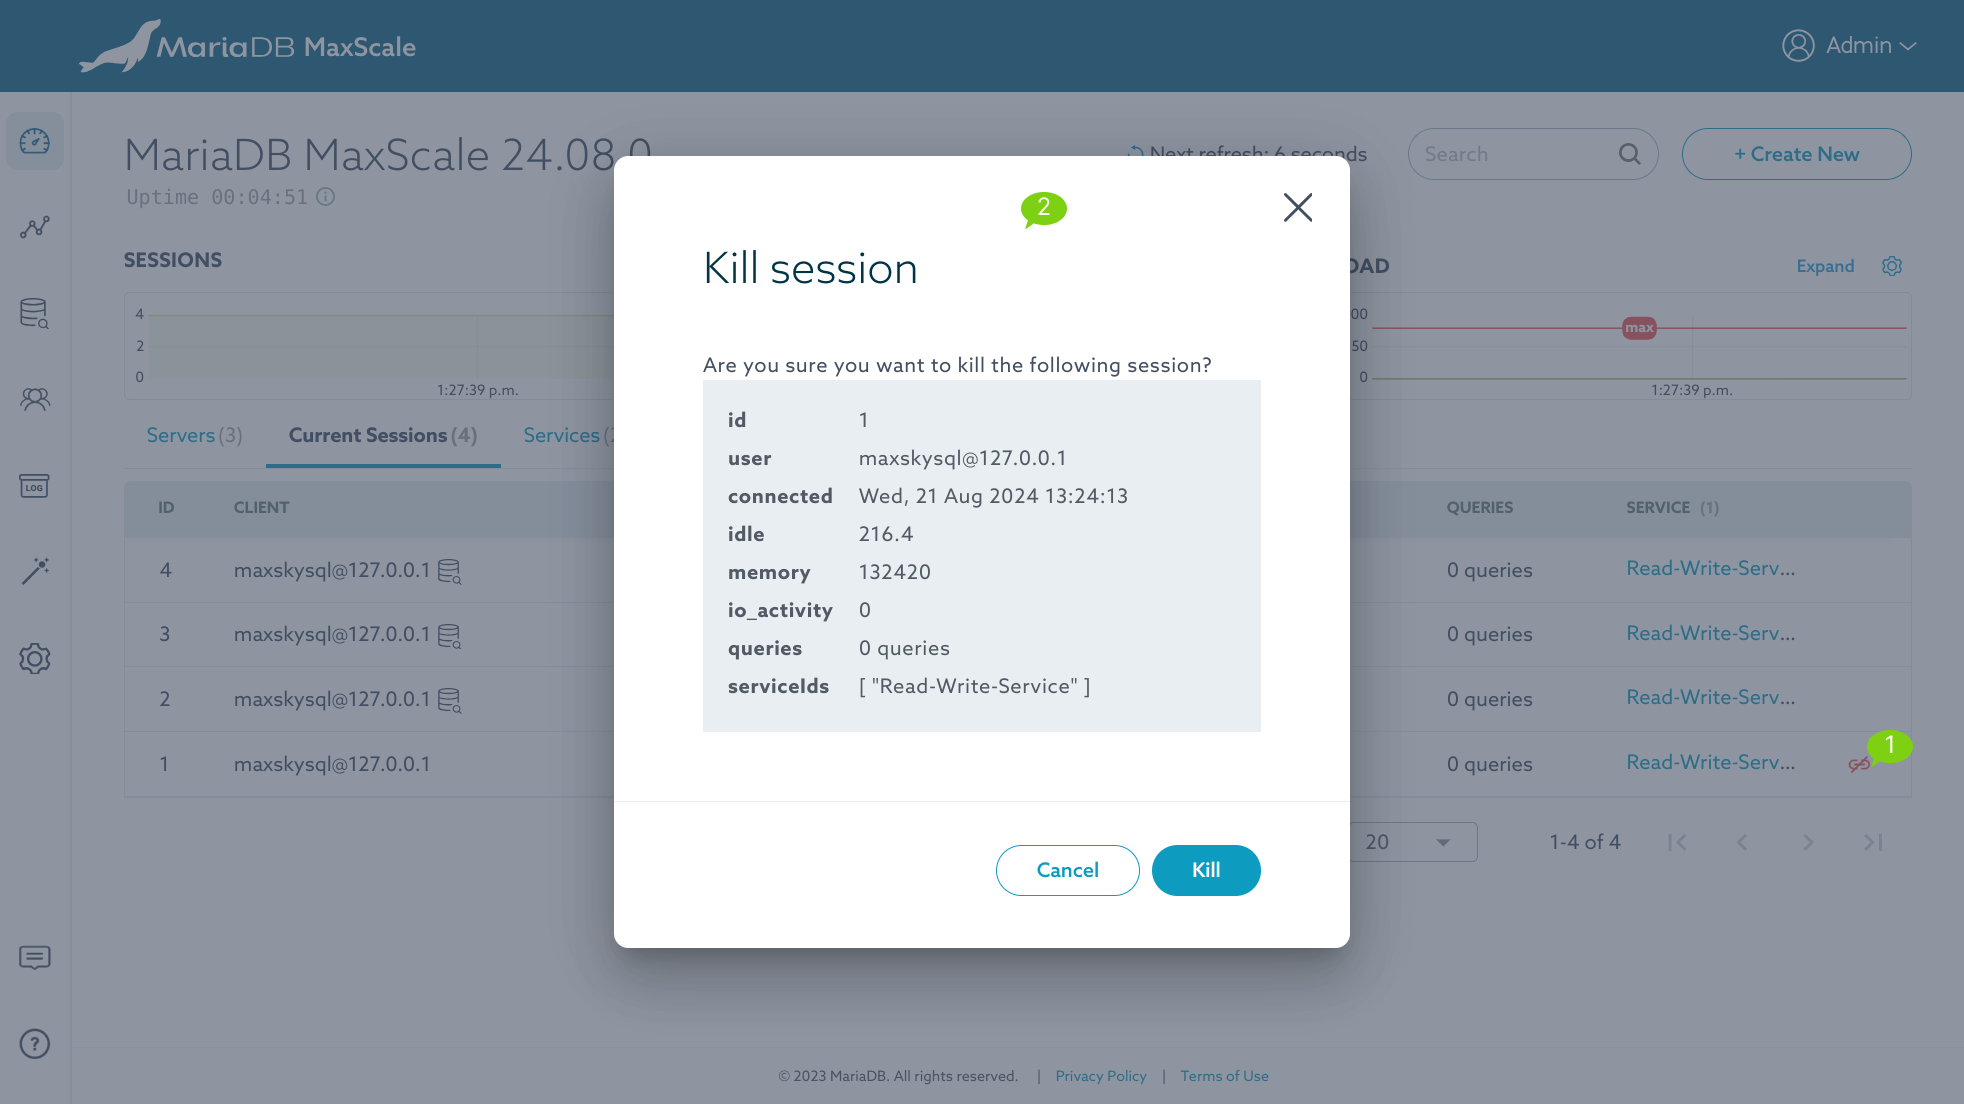
Annotation
- Kill session button. This button is shown on the mouse hover.
- Confirm killing the session dialog.
View sessions created by the "Workspace"
Sessions created by the "Workspace", such as via the Query Editor can be found in two places:
Dashboard "Current Sessions" tab
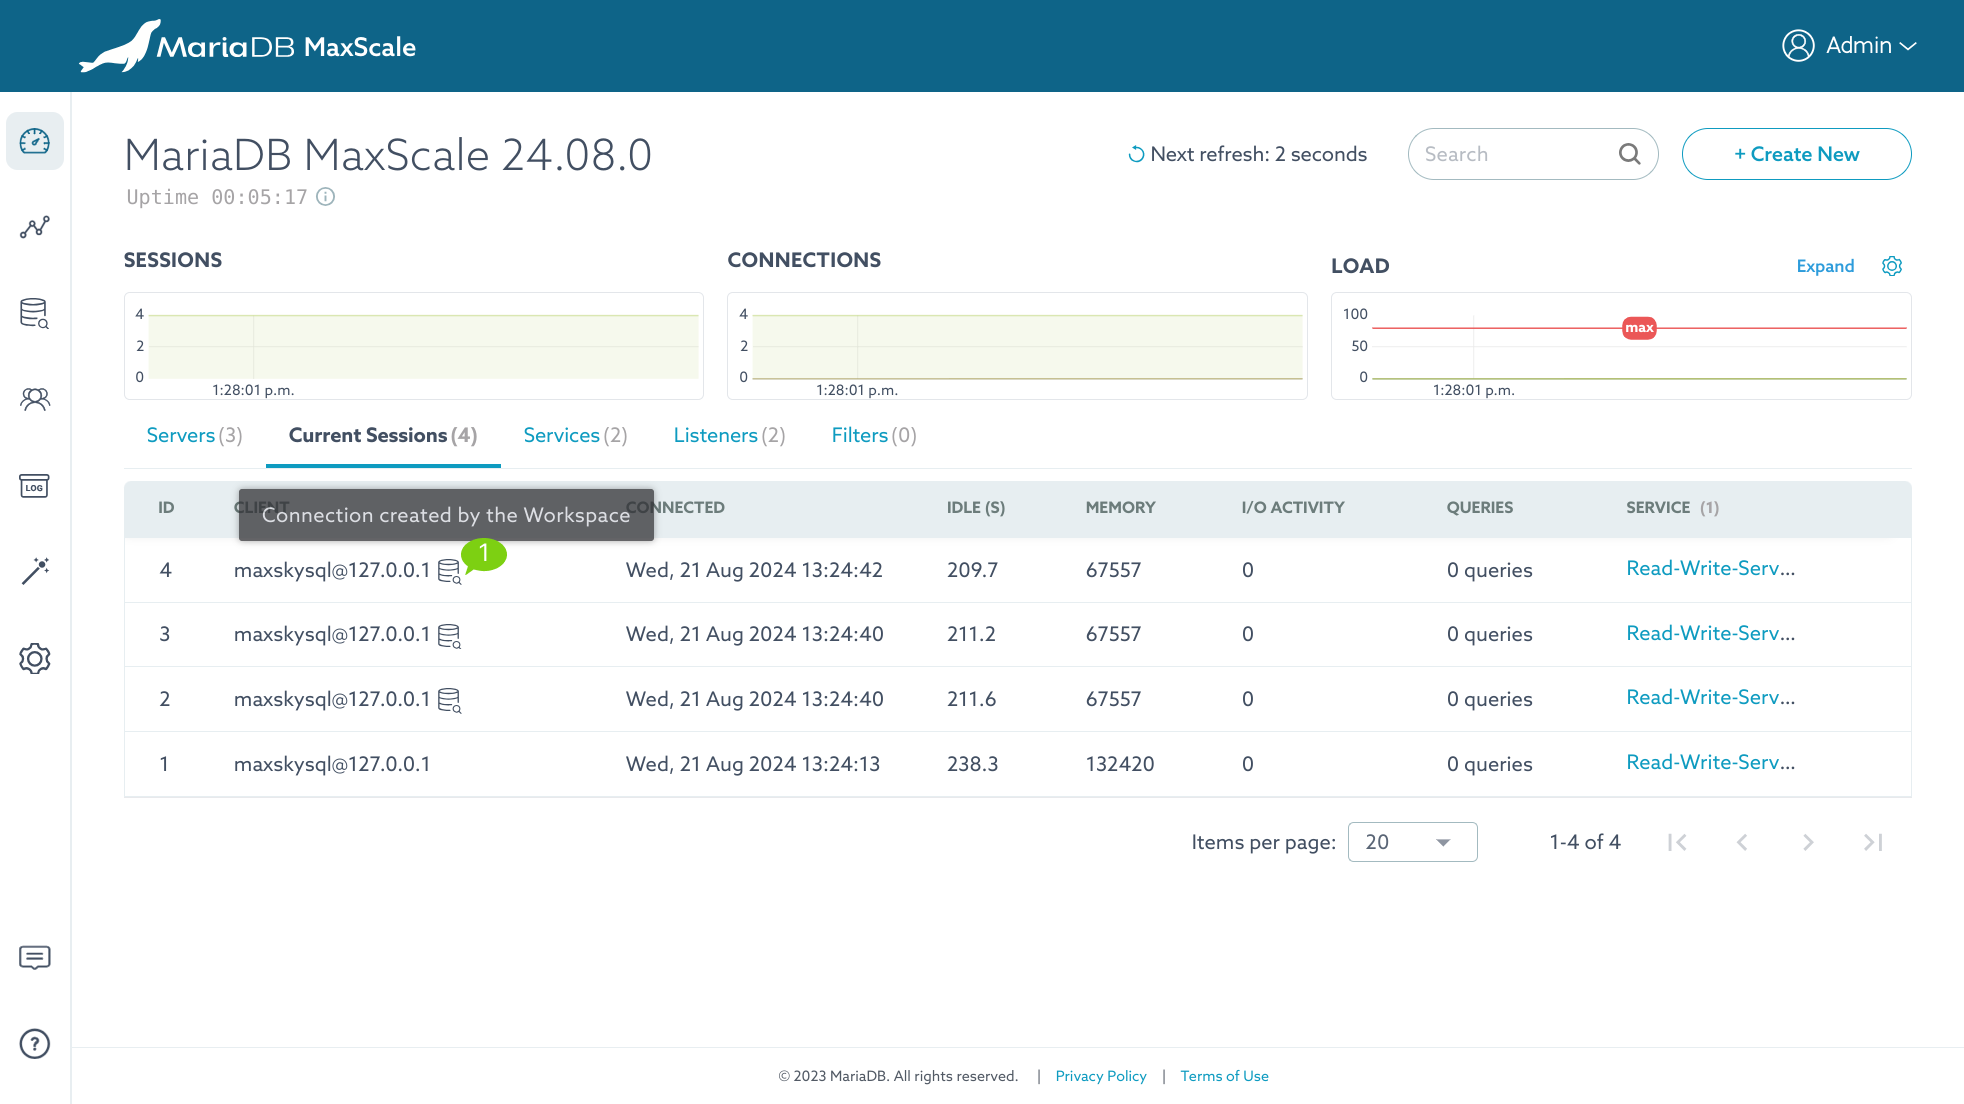
Annotation
- A session with an icon next to the "CLIENT" column indicates a connection created by the "Workspace".
Query Editor "Processlist"
This table displays the result set from the PROCESSLIST table, with options to
filter processes created by the "Workspace".
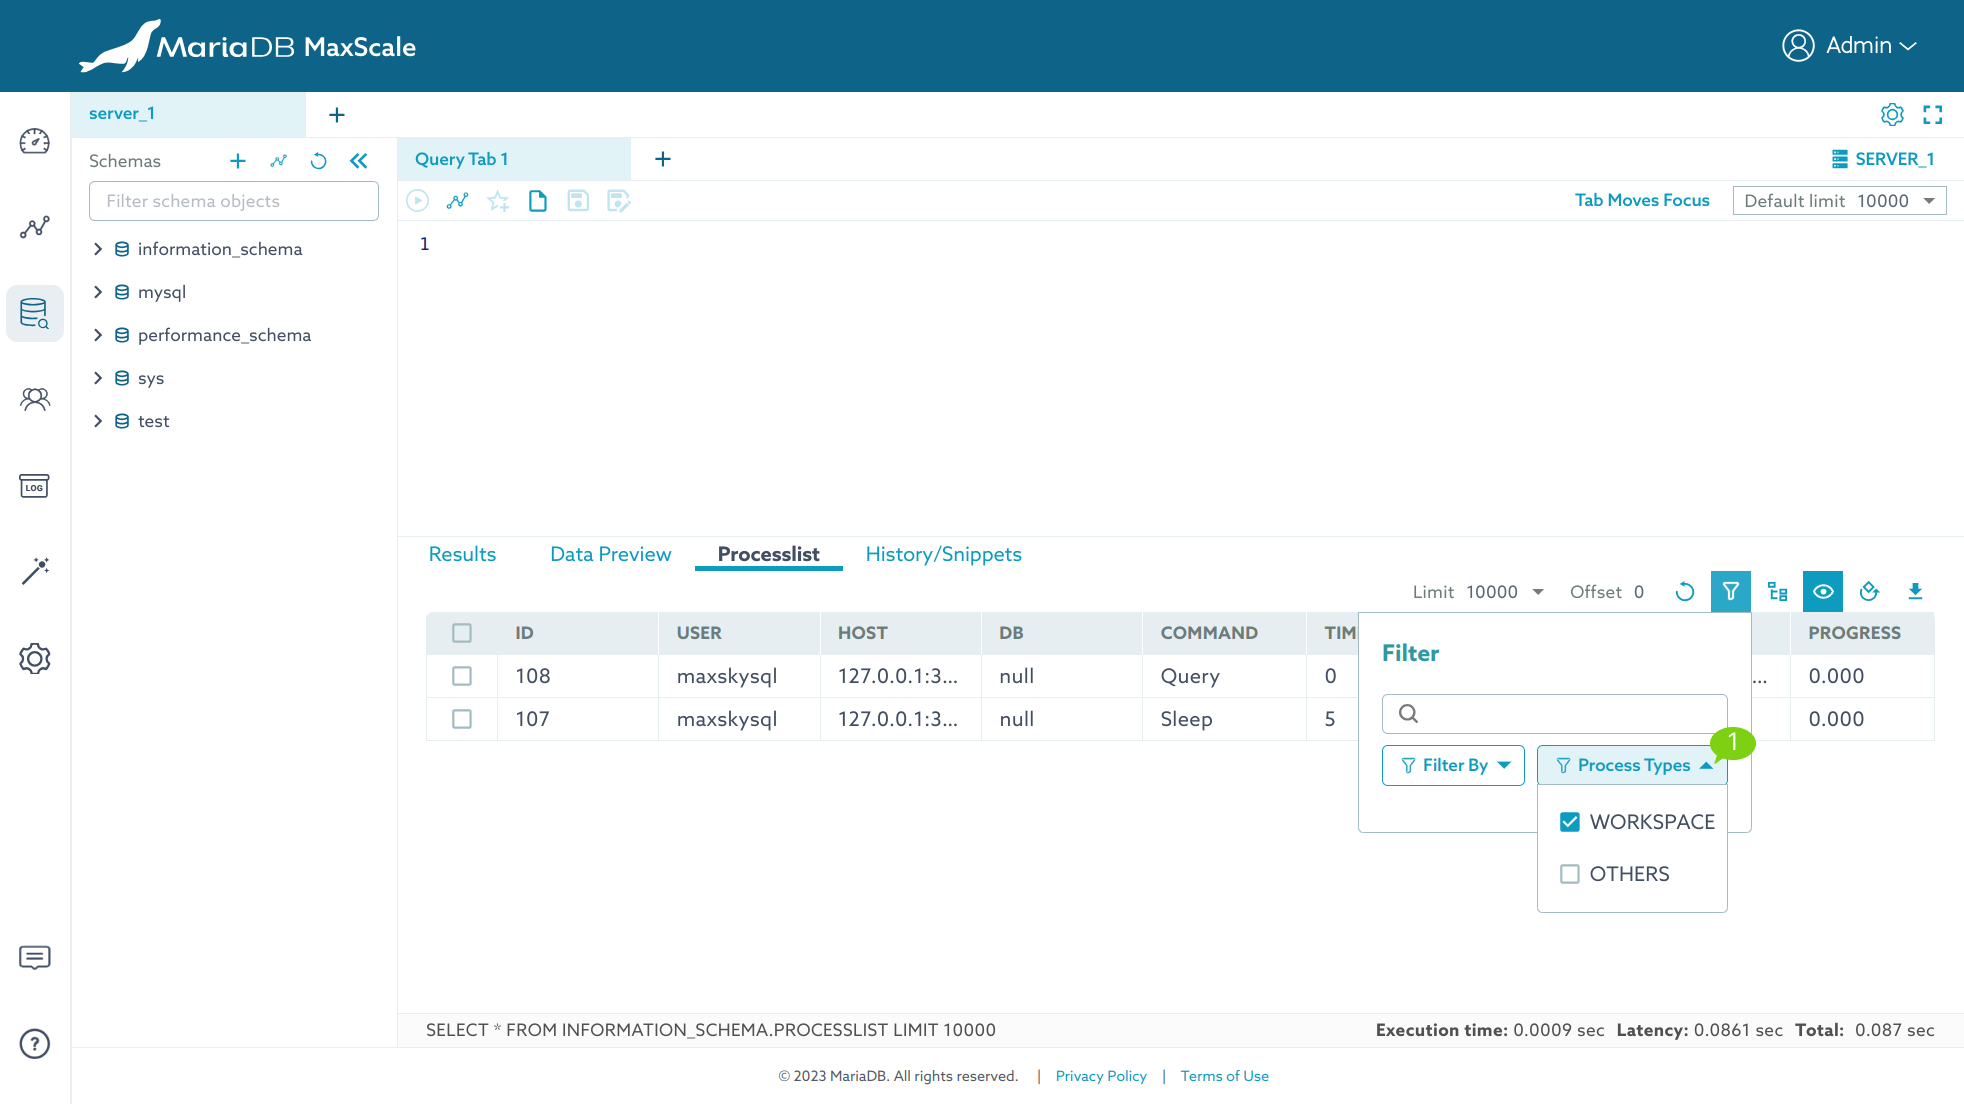
Annotation
- Filter option.
Detail
This page shows information on each MaxScale object and allow to edit its parameter, relationships and perform other manipulation operations. Most of the control buttons will be shown on the mouse hover. Below is a screenshot of a Monitor Detail page, other Detail pages also have a similar layout structure so this is used for illustration purpose.
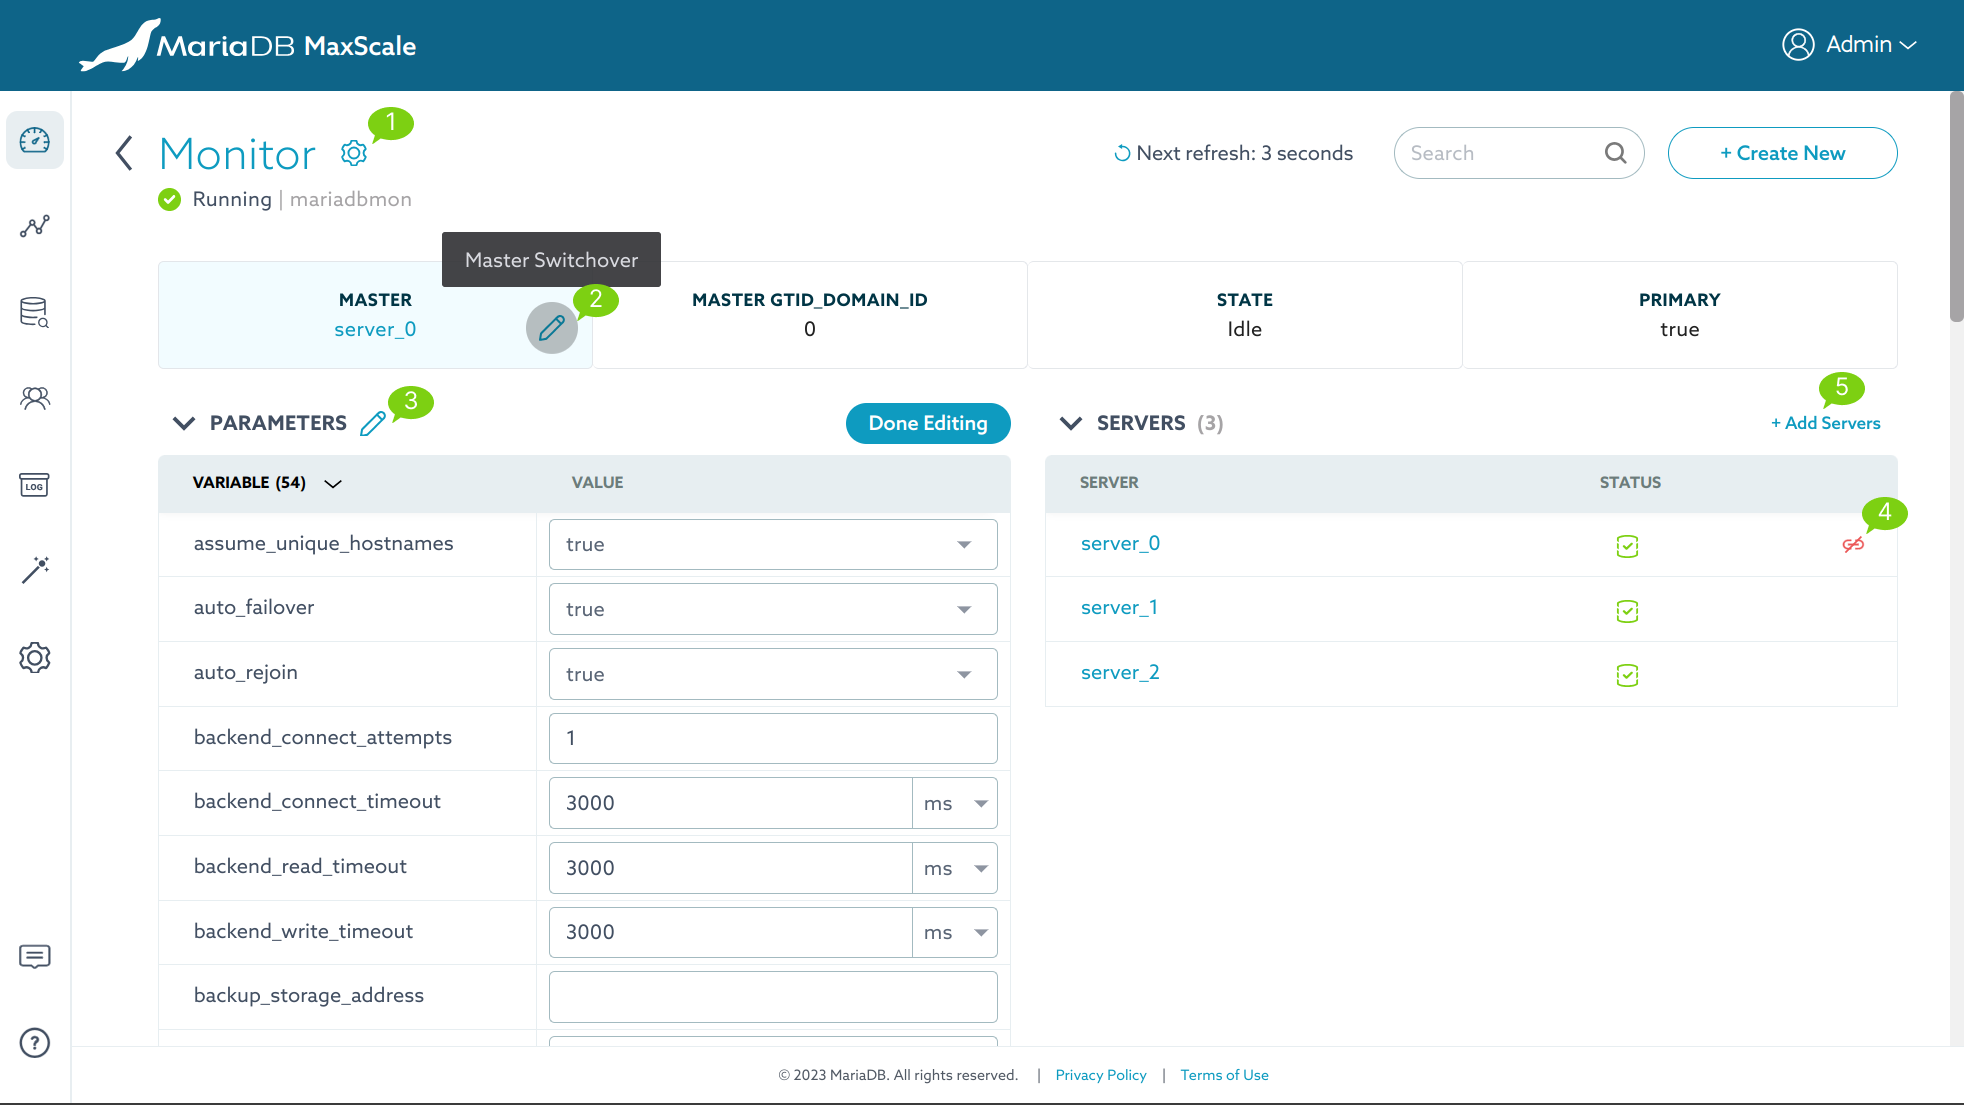
Annotation
- Settings option. Clicking on the gear icon will show icons allowing to do
different operations depending on the type of the Detail page.
- Monitor Detail page, there are icons to Stop, Start, and Destroy monitor.
- Service Detail page, there are icons to Stop, Start, and Destroy service.
- Server Detail page, there are icons to Set maintenance mode, Clear server state, Drain and Delete server.
- Filter and Listener Detail page, there is a delete icon to delete the object.
- Switchover button. This button is shown on the mouse hover allowing to swap the running primary server with a designated secondary server.
- Edit parameters button. This button is shown on the mouse hover allowing to edit the MaxScale object's parameter. Clicking on it will enable editable mode on the table. After finishing editing the parameters, simply click the Done Editing button.
- A Detail page has tables showing "Relationship" between other MaxScale object. This "unlink" icon is shown on the mouse hover allowing to remove the relationship between two objects.
- This button is used to link other MaxScale objects to the relationship.
Visualization
This page visualizes MaxScale configuration and clusters.
Configuration
This page visualizes MaxScale configuration as shown in the figure below.
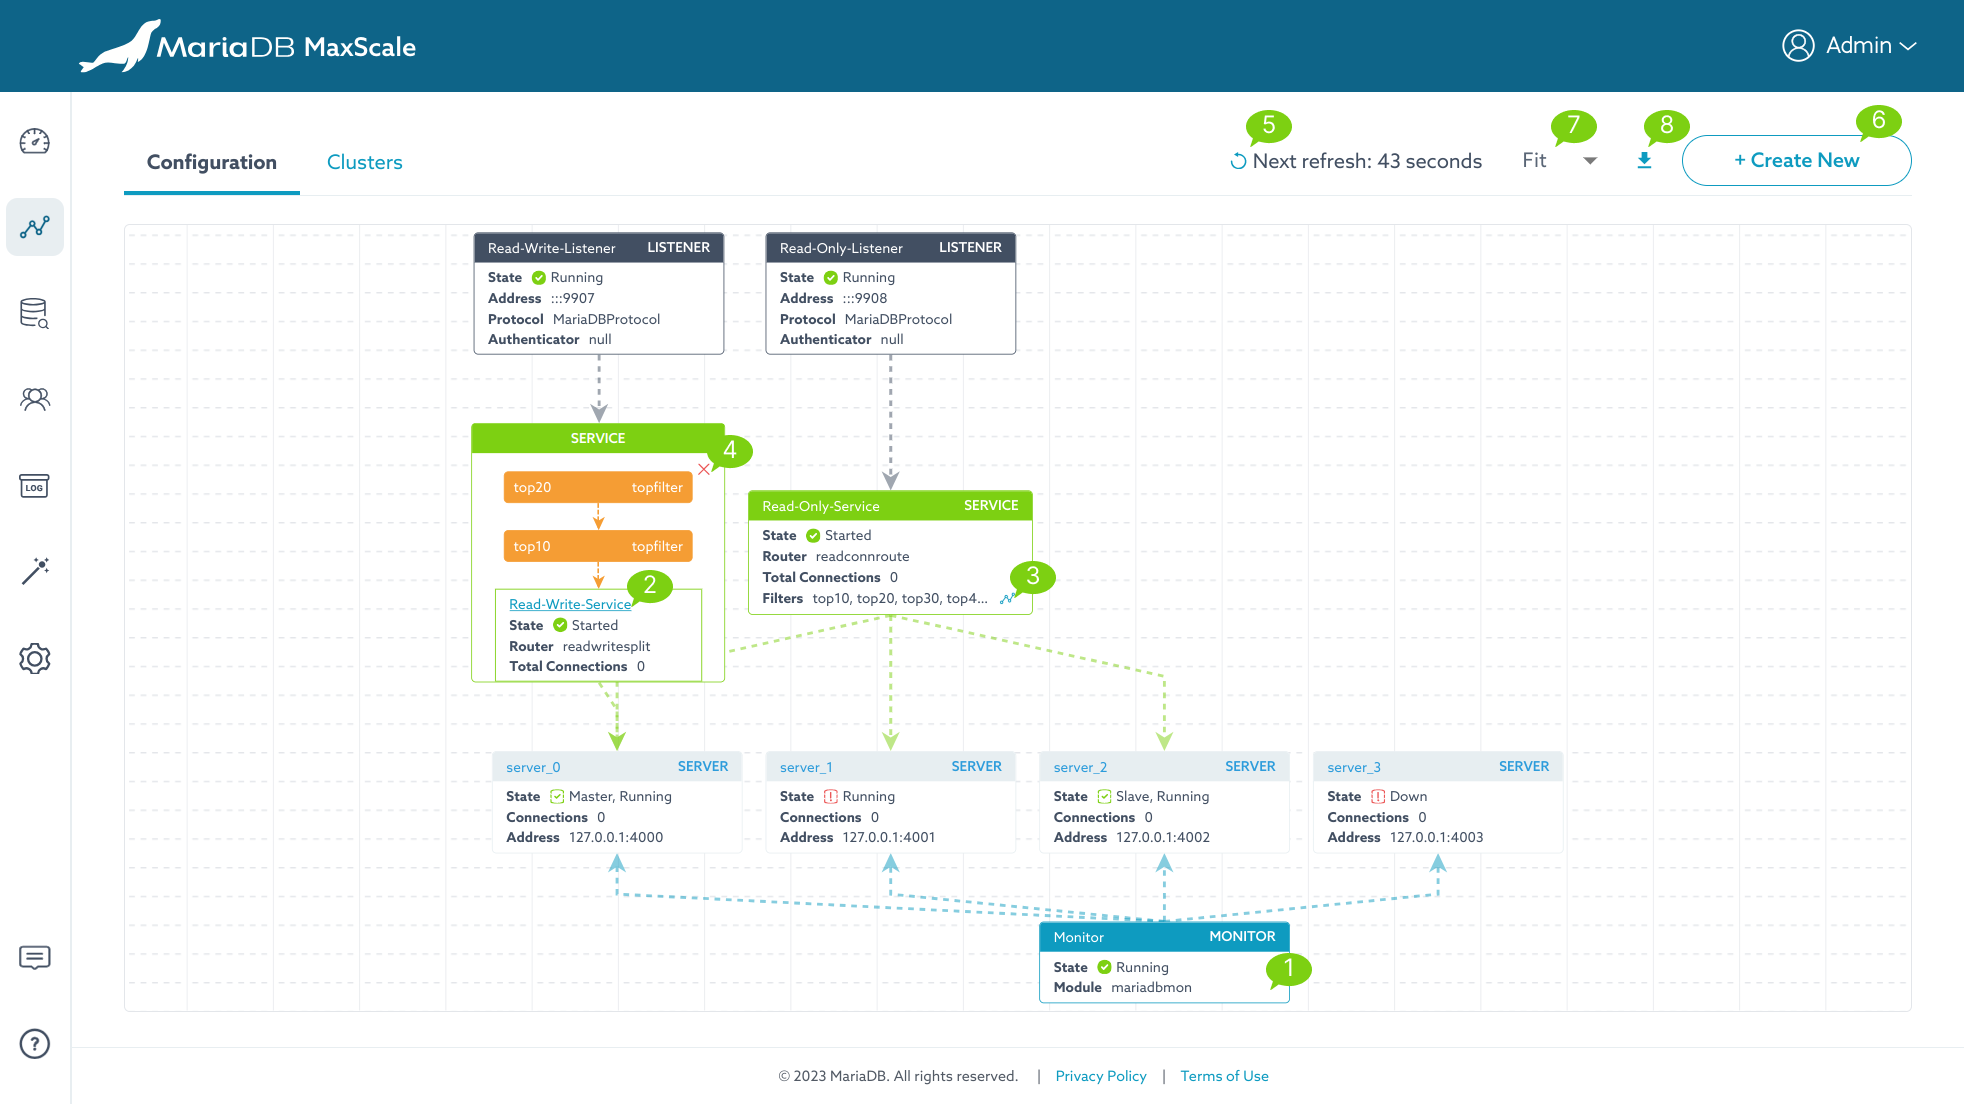
Annotation
- A MaxScale object (a node graph). The position of the node in the graph can be changed by dragging and dropping it.
- Anchor link. The detail page of each MaxScale object can be accessed by clicking on the name of the node.
- Filter visualization button. By default, if the number of filters used by a service is larger than 3, filter nodes aren't visualized as shown in the figure. Clicking this button will visualize them.
- Hide filter visualization button.
- Refresh rate dropdown. The frequency with which the data is refreshed.
- Create a new MaxScale object button.
- Zoom level control.
- Export diagram as jpeg.
Clusters
This page shows all monitor clusters using mariadbmon module in a card-like view. Clicking on the card will visualize the cluster into a tree graph as shown in the figure below.
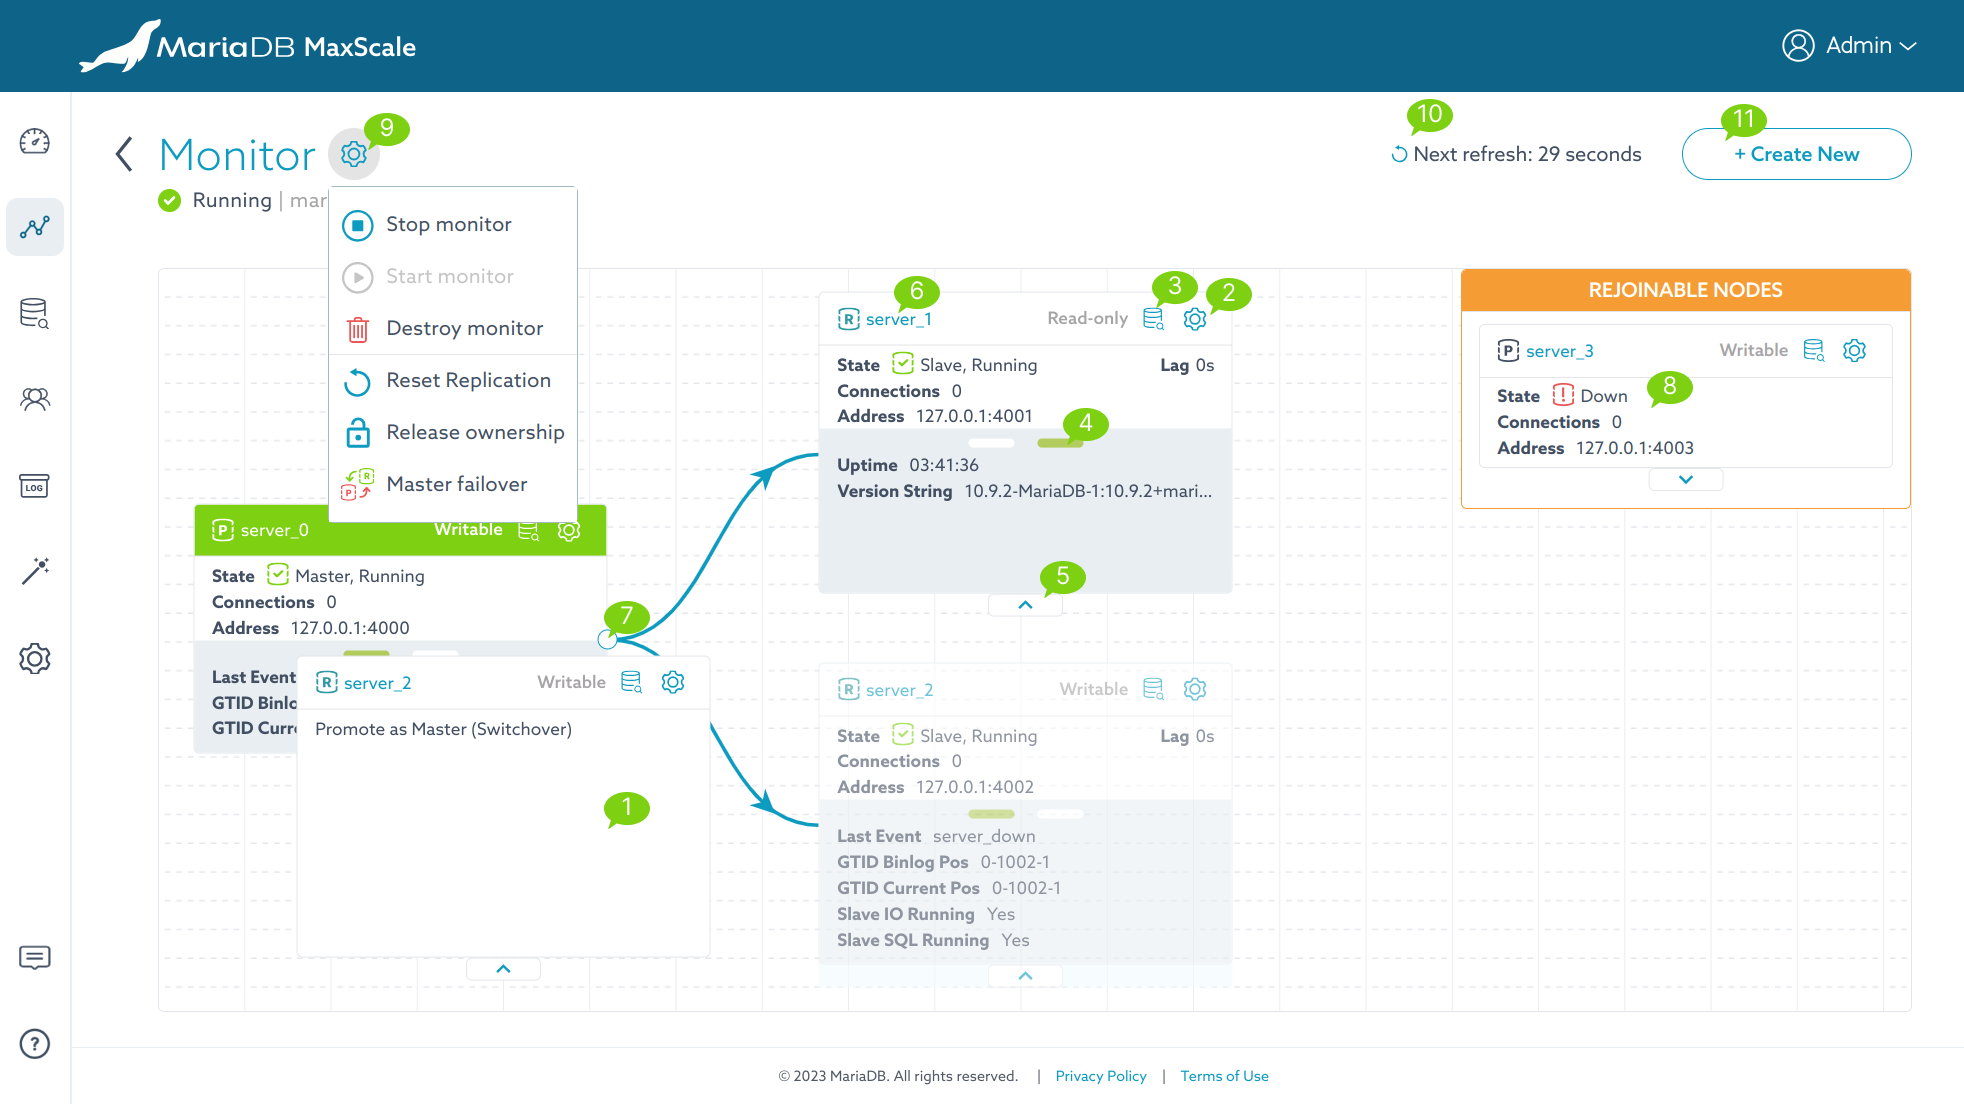
Annotation
- Drag a secondary server on top of a primary server to promote the secondary server as the new primary server.
- Server manipulation operations button. Showing a dropdown with the following
operations:
- Set maintenance mode: Setting a server to a maintenance mode.
- Clear server state: Clear current server state.
- Drain server: Drain the server of connections.
- Quick access to query editor button. Opening the
Query Editorpage for this server. If the connection is already created for that server, it'll use it. Otherwise, it creates a blank worksheet and shows a connection dialog to connect to that server. - Carousel navigation button. Viewing more information about the server in the next slide.
- Collapse the carousel.
- Anchor link of the server. Opening the detail page of the server in a new tab.
- Collapse its children nodes.
- Rejoin node. When the
auto_rejoinparameter is disabled, the node can be manually rejoined by dragging it on top of the primary server. -
Monitor manipulation operations button. Showing a dropdown with the following operations:
- Stop monitor.
- Start monitor.
- Destroy monitor.
- Reset Replication.
- Release ownership
- Master failover. Manually performing a primary failover. This option is
visible only when the
auto_failoverparameter is disabled.
ColumnStore operations:
- Stop cluster
- Start cluster
- Set cluster Read-Only
- Set cluster Read-Write
- Add node to cluster
- Remove node from cluster
-
Refresh rate dropdown. The frequency with which the data is refreshed.
- Create a new MaxScale object button.
Settings
This page shows and allows editing of MaxScale parameters.
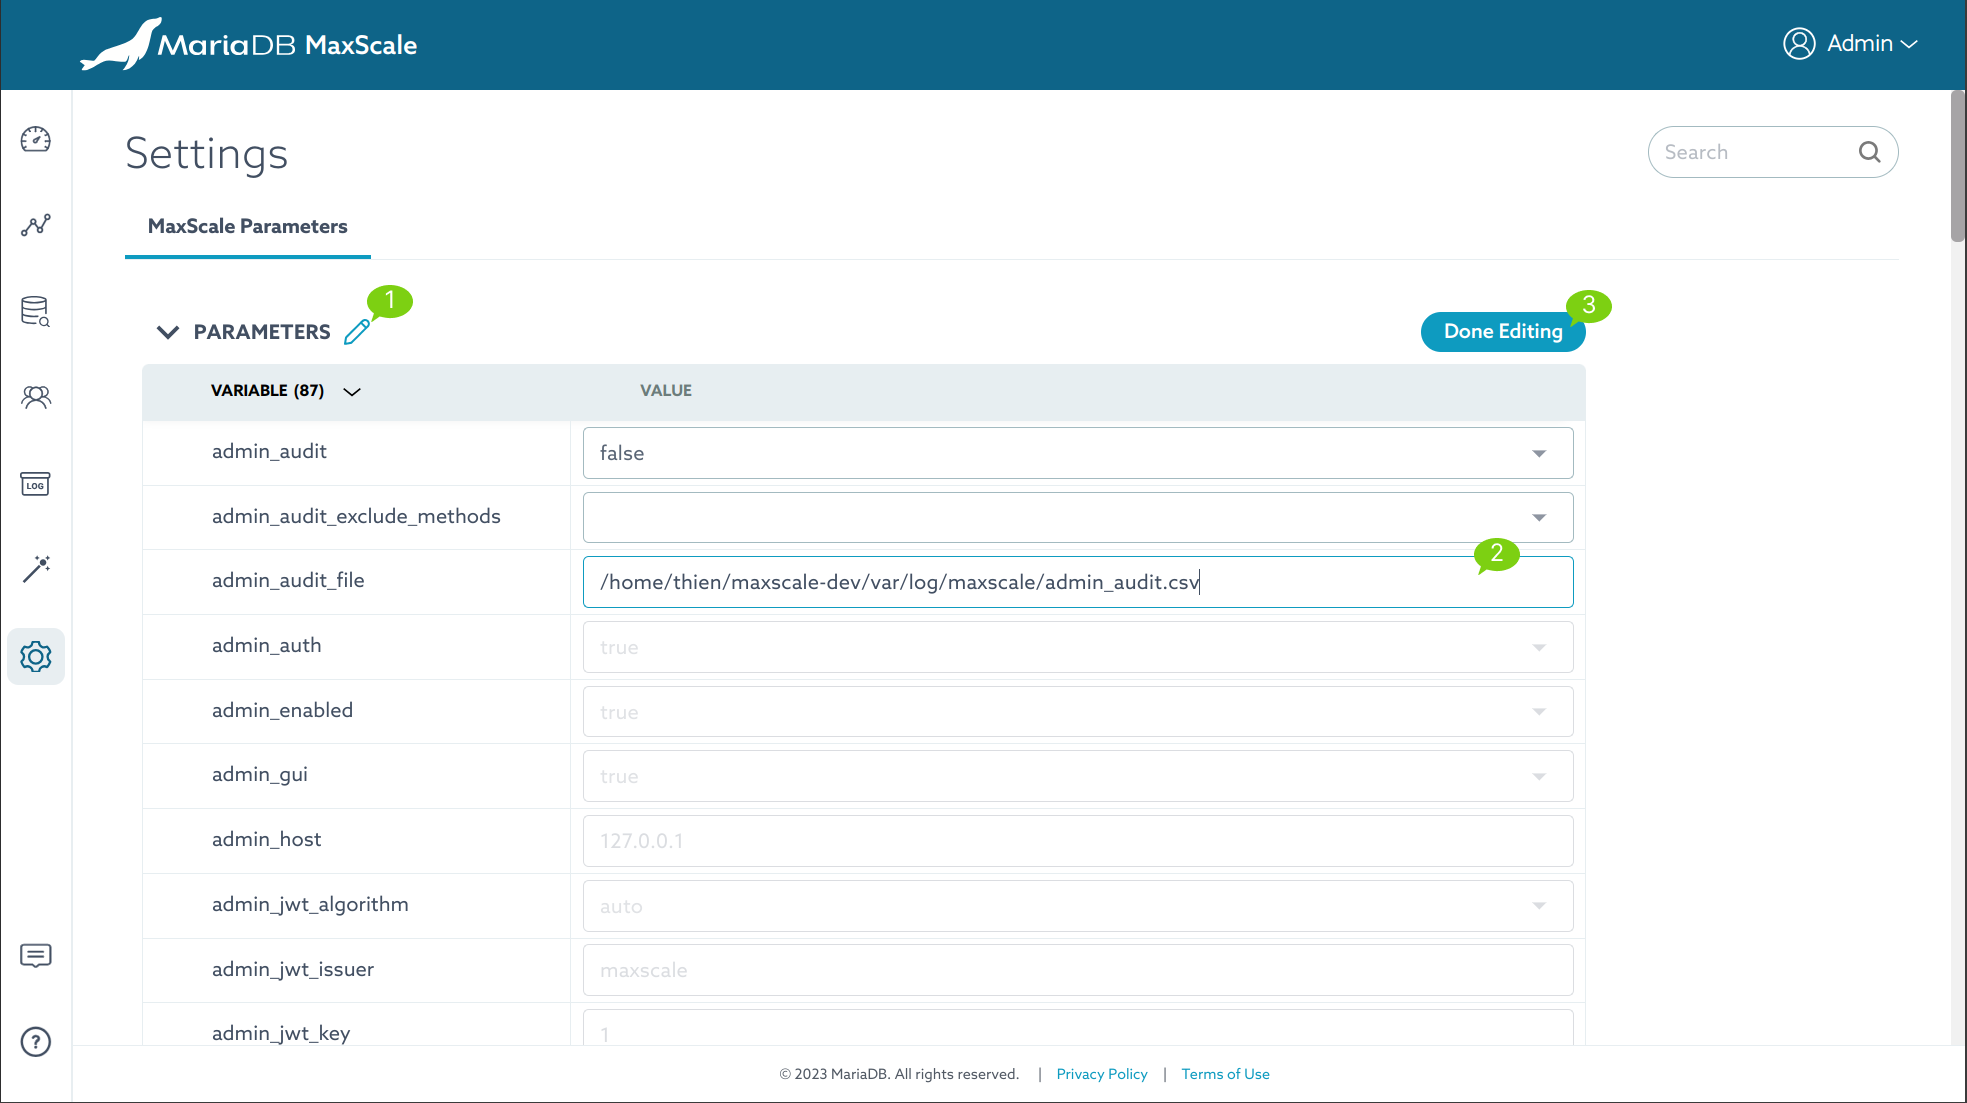
Annotation
- Edit parameters button. This button is shown on the mouse hover allowing to edit the MaxScale parameter. Clicking on it will enable editable mode on the table..
- Editable parameters are visible as it's illustrated in the screenshot.
- After finishing editing the parameters, simply click the Done Editing button.
Logs Archive
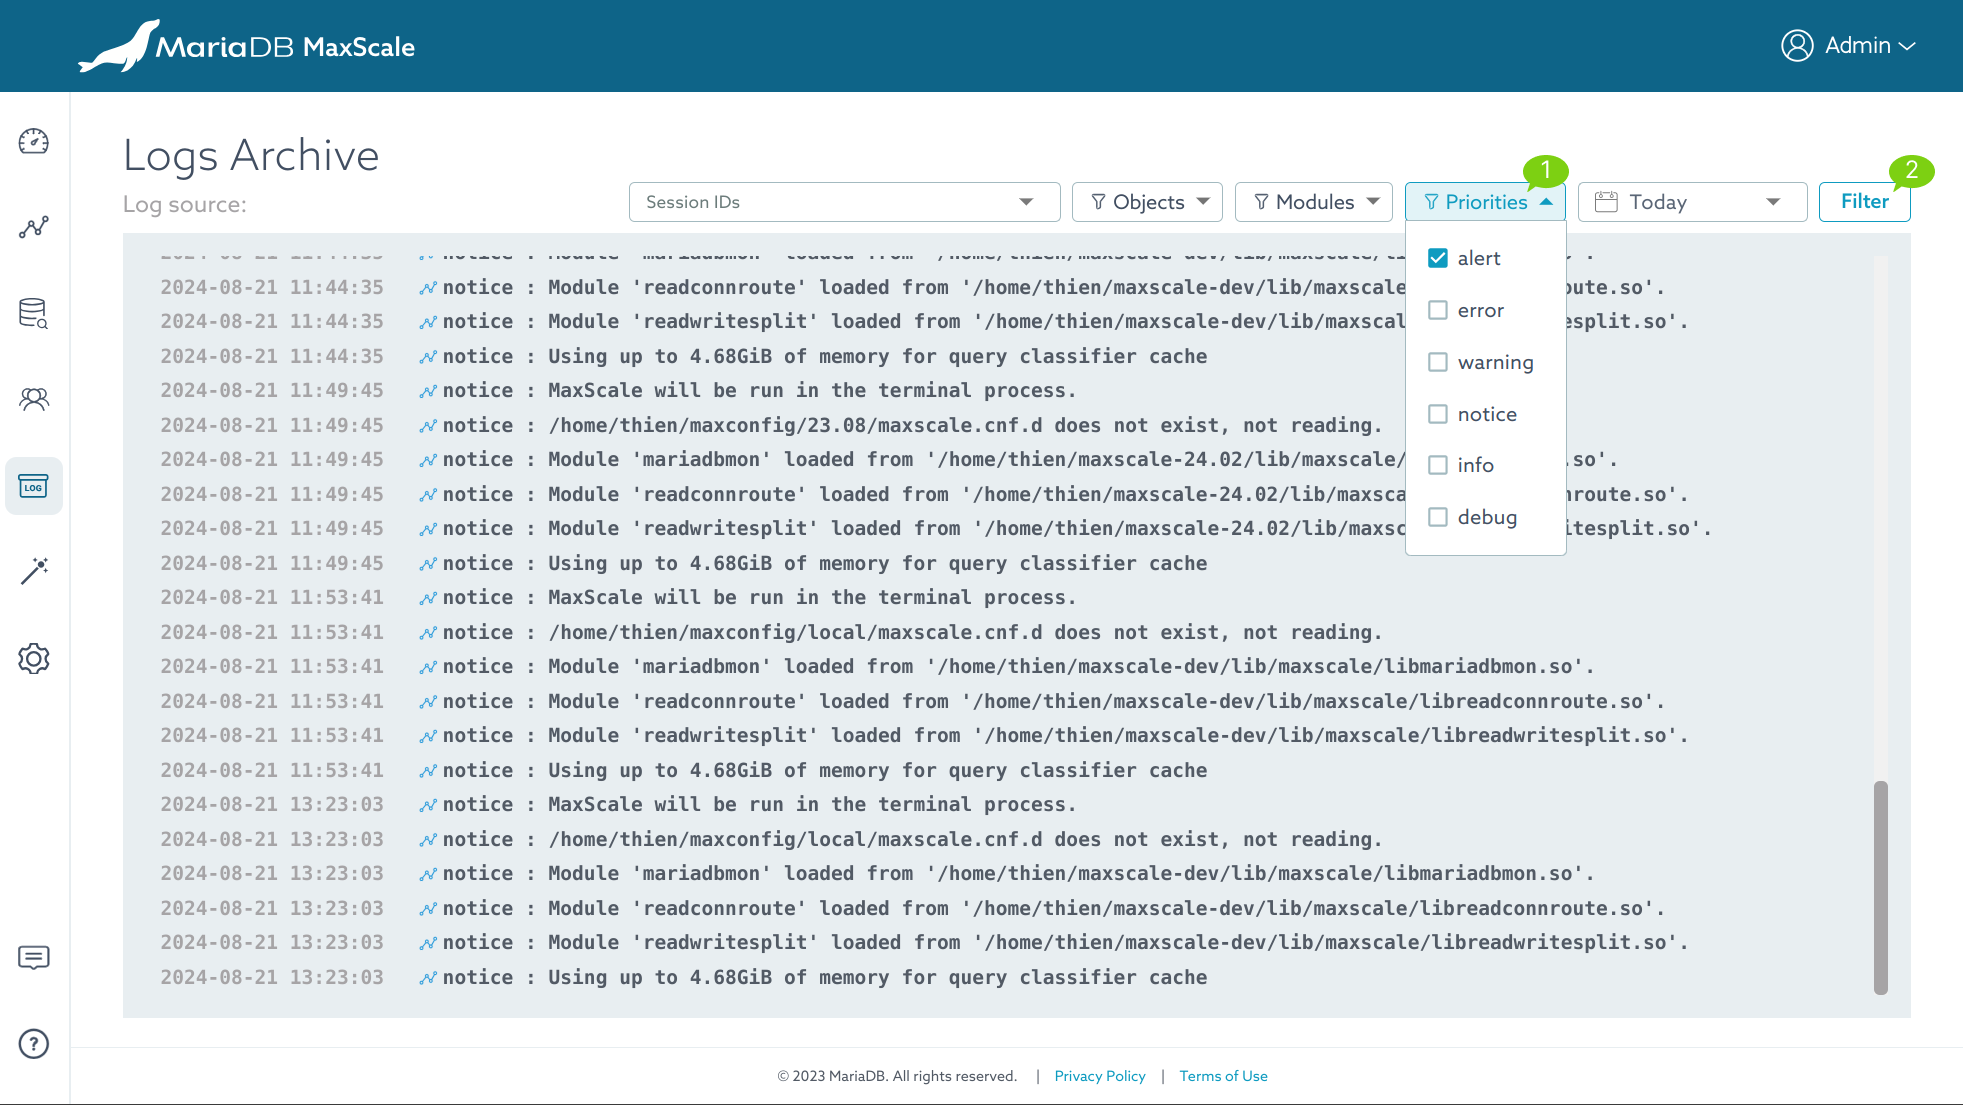
This page show real-time MaxScale logs with filter options.
Annotation
- Filter by priorities.
- Apply filter button.
Workspace
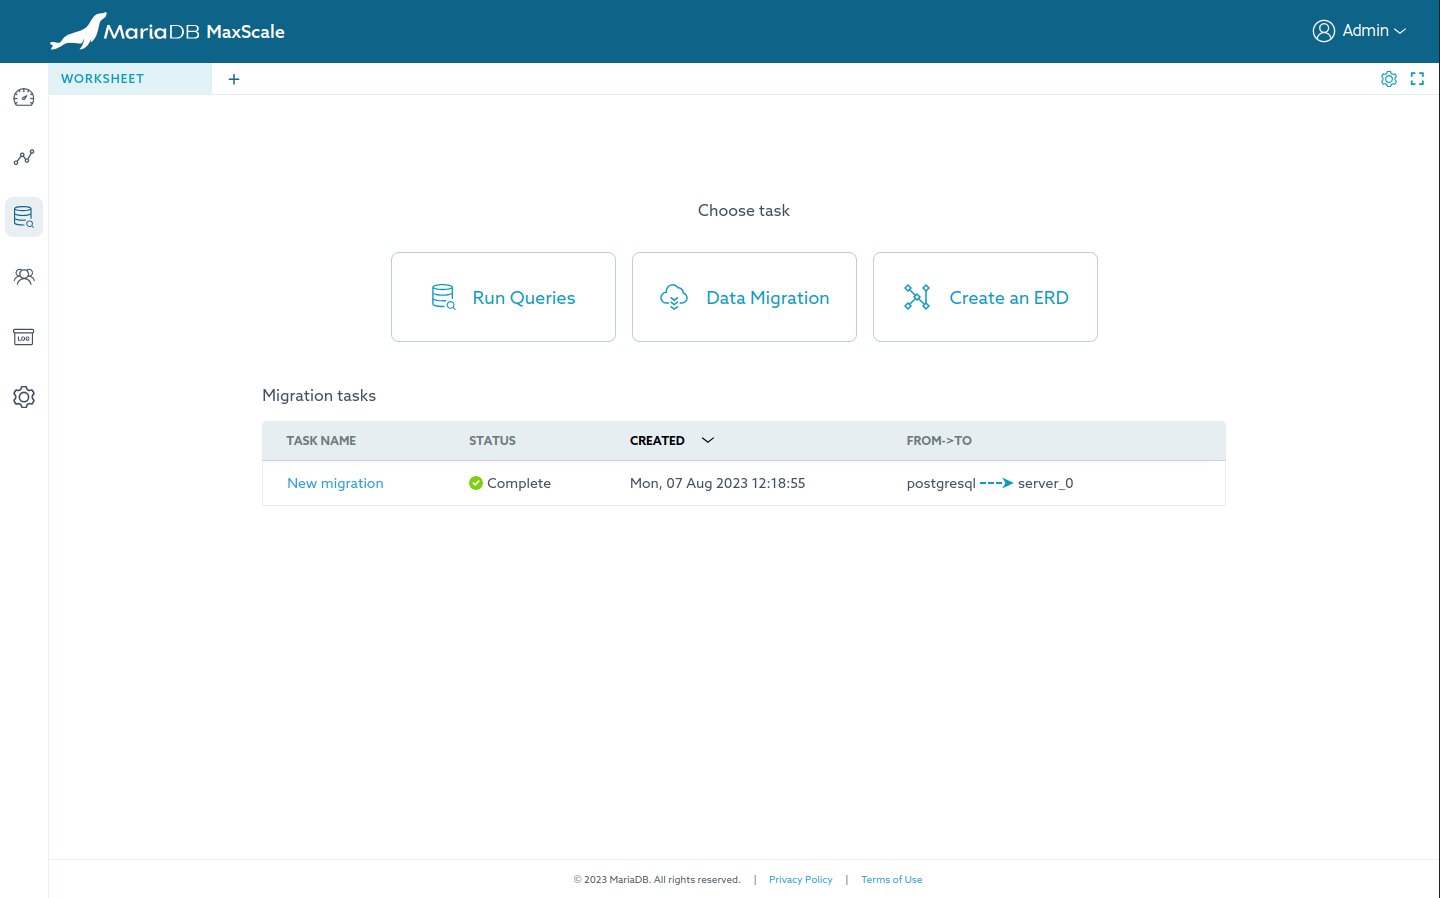
On this page, you may add numerous worksheets, each of which can be used for "Run queries", "Data migration" or "Create an ERD" task.
Run Queries
Clicking on the "Run Queries" card will open a dialog, providing options to establish a connection to different MaxScale object types, including "Listener, Server, Service".
The Query Editor worksheet will be rendered in the active worksheet after correctly connecting.
Query Editor worksheet
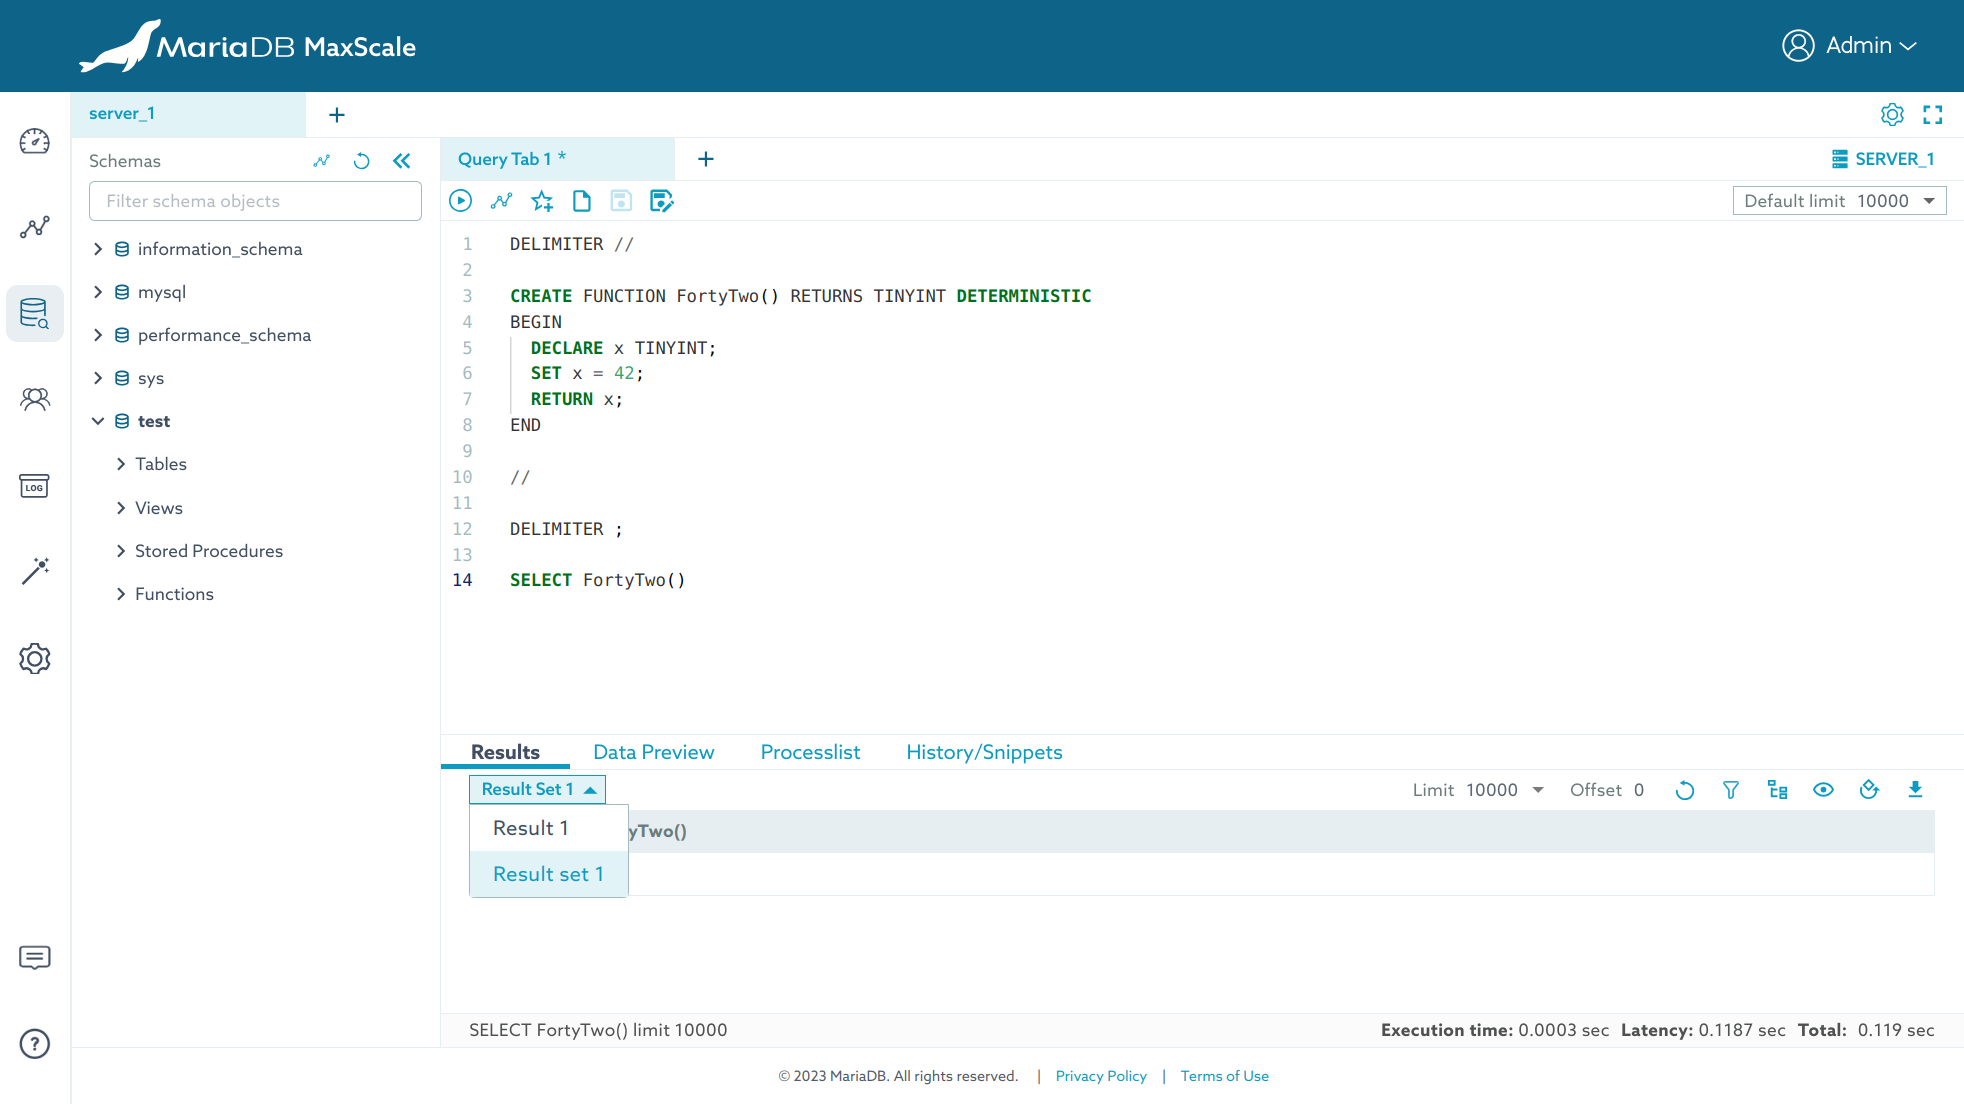
There are various features in the Query Editor worksheet, the most notable ones are listed below.
Create a new connection
If the connection of the Query Editor expires, or if you wish to make a new connection for the active worksheet, simply clicking on the button located on the right side of the query tabs navigation bar which features a server icon and an active connection name as a label. This will open the connection dialog and allow you to create a new connection.
Schemas objects sidebar
Set the current database
There are two ways to set the current database:
- Double-click on the name of the database.
- Right-click on the name of the database to show the context menu, then select
the
Use databaseoption.
Preview table data of the top 1000 rows
There are two ways to preview data of a table:
- Click on the name of the table.
- Right-click on the name of the table to show the context menu, then select
the
Preview Data (top 1000)option.
Describe table
Right-click on the name of the table to show the context menu, then select the
View Details option.
Alter/Drop/Truncate/Create table
Right-click on the name of the table to show the context menu, then select the desired option.
Alter/Drop/Create schema
Right-click on the name of the schema to show the context menu, then select the desired option.
Alter/Create View, Function, Stored Procedure, Trigger
Right-click on the group node (e.g., Views, Functions, Stored Procedures, Triggers) to show the context menu, then select the desired option.
Quickly insert an object into the editor
There are two ways to quickly insert an object to the editor:
- Drag the object and drop it in the desire position in the editor.
- Right-click on the object to show the context menu, then mouse
hover the
Place to Editoroption and select the desired insert option.
Show object creation statement and insights info
To view the statement that creates the given object in the Schemas objects sidebar, right-clicking on schema or table node and
select the View Insights option. For other objects such as view, stored
procedure, function and trigger, select the Show Create option.
Editor
The editor is powered by Monaco editor, therefore, its features are similar to those of Visual Studio Code.
To see the command palette, press F1 while the cursor is active on the editor.
The editor also comes with various options to assist your querying tasks. To see available options, right-click on the editor to show the context menu.
The editor is powered by Monaco editor, therefore, its features are similar to those of Visual Studio Code.
How to write compound statements
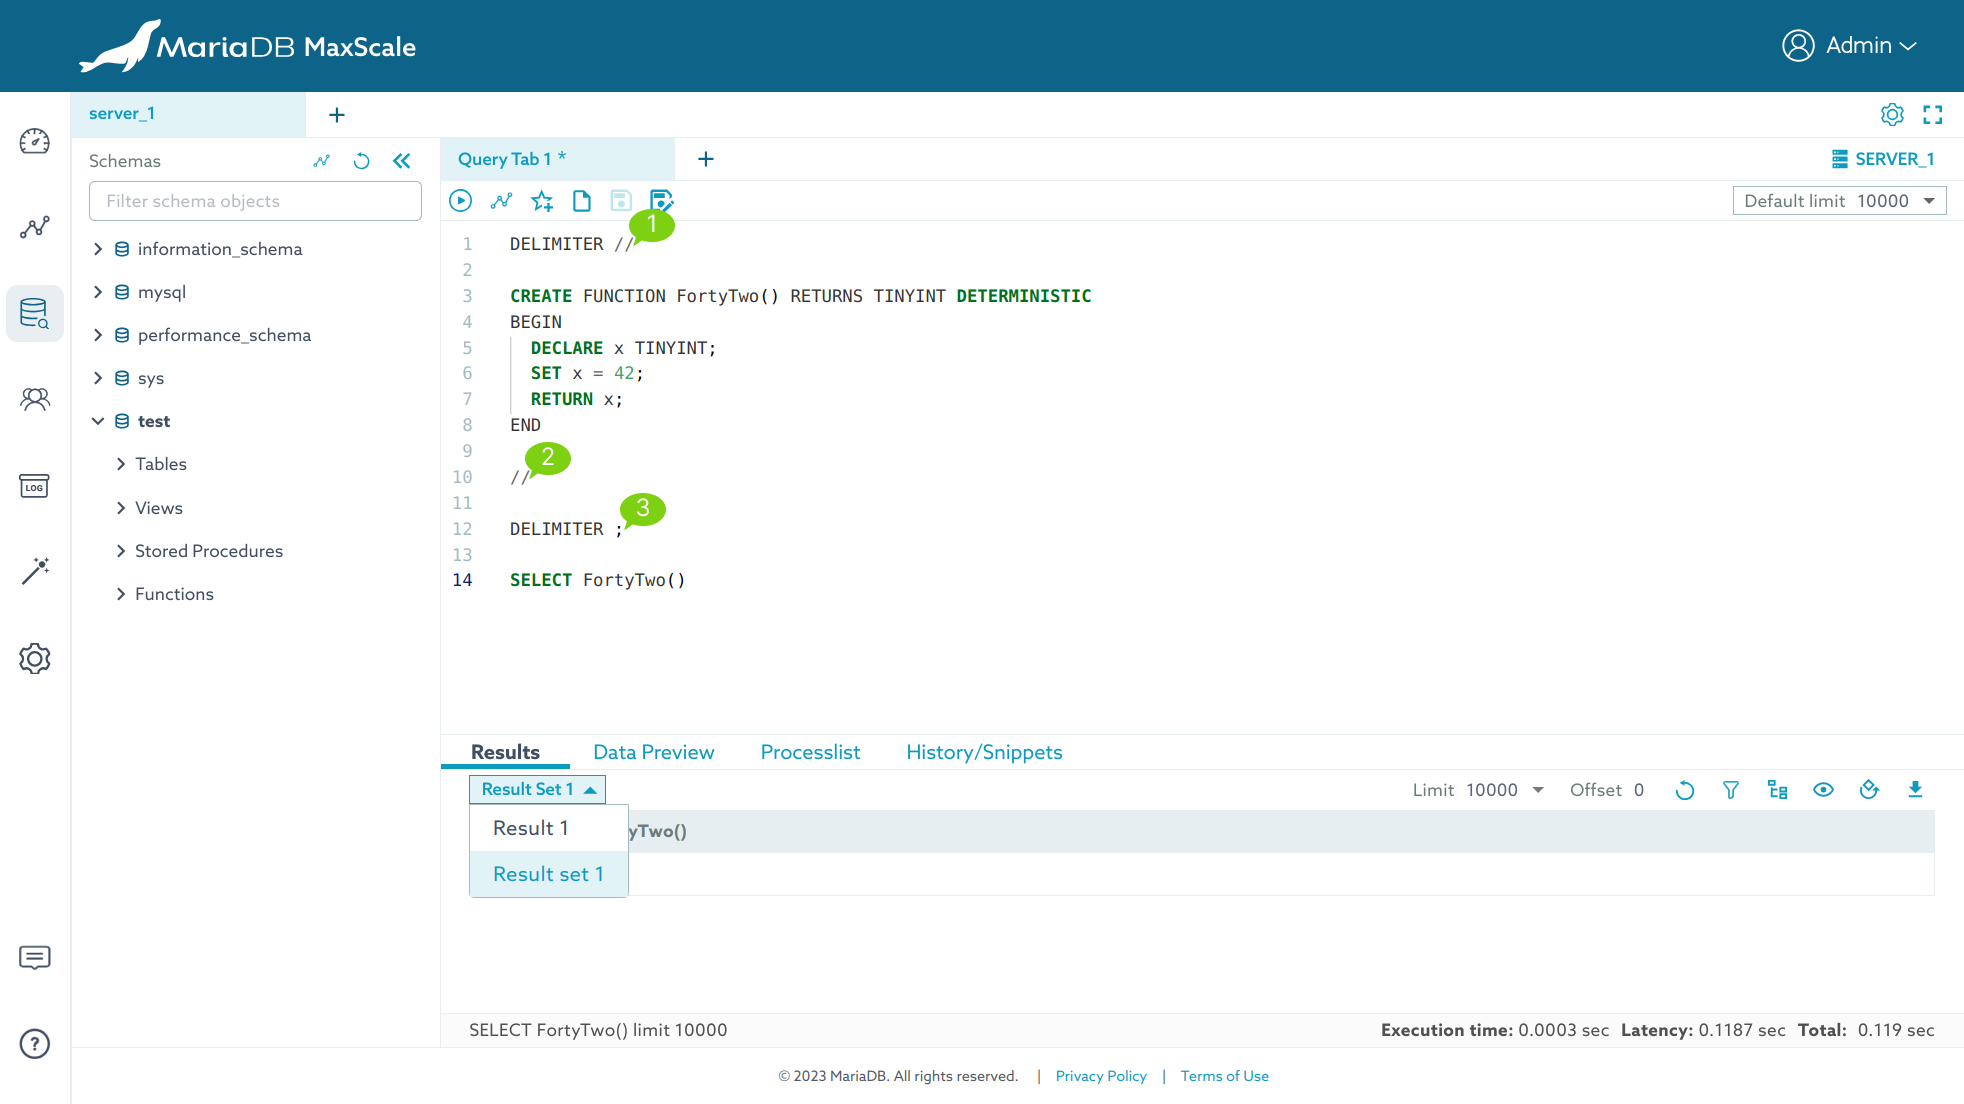
By default, all statements in the "Query Tab" are split by semicolons and
executed one by one on the server. To write the compound statements, use
the DELIMITER command to change the delimiter.
Annotation
- Change the delimiter to
// - End of the statement using the new delimiter
- Change the delimiter back to the default semicolon.
Re-execute old queries
Every executed query will be saved in the browser's storage (IndexedDB).
Query history can be seen in the History/Snippets tab.
To re-execute a query, follow the same step to insert an object into the editor
and click the execute query button in the editor.
Create query snippet
Press CTRL/CMD + D to save the current SQL in the editor to the snippets storage. A snippet is created with a prefix keyword, so when that keyword is typed in the editor, it will be suggested in the "code completion" menu.
Generate an ERD
To initiate the process, either right-click on the schema name and select the
Generate ERD option, or click on the icon button that resembles a line graph,
located on the schemas sidebar. This will open a dialog for selecting the
tables for the diagram.
Data Migration
Clicking on the "Data Migration" card will open a dialog, providing an option
to name the task. The Data Migration worksheet will be rendered in the active
worksheet after clicking the Create button in the dialog.
Data Migration worksheet
MaxScale uses ODBC for extracting and loading from the data source to a server in MaxScale. Before starting a migration, ensure that you have set up the necessary configurations on the MaxScale server. Instruction can be found here and limitations here.
Connections
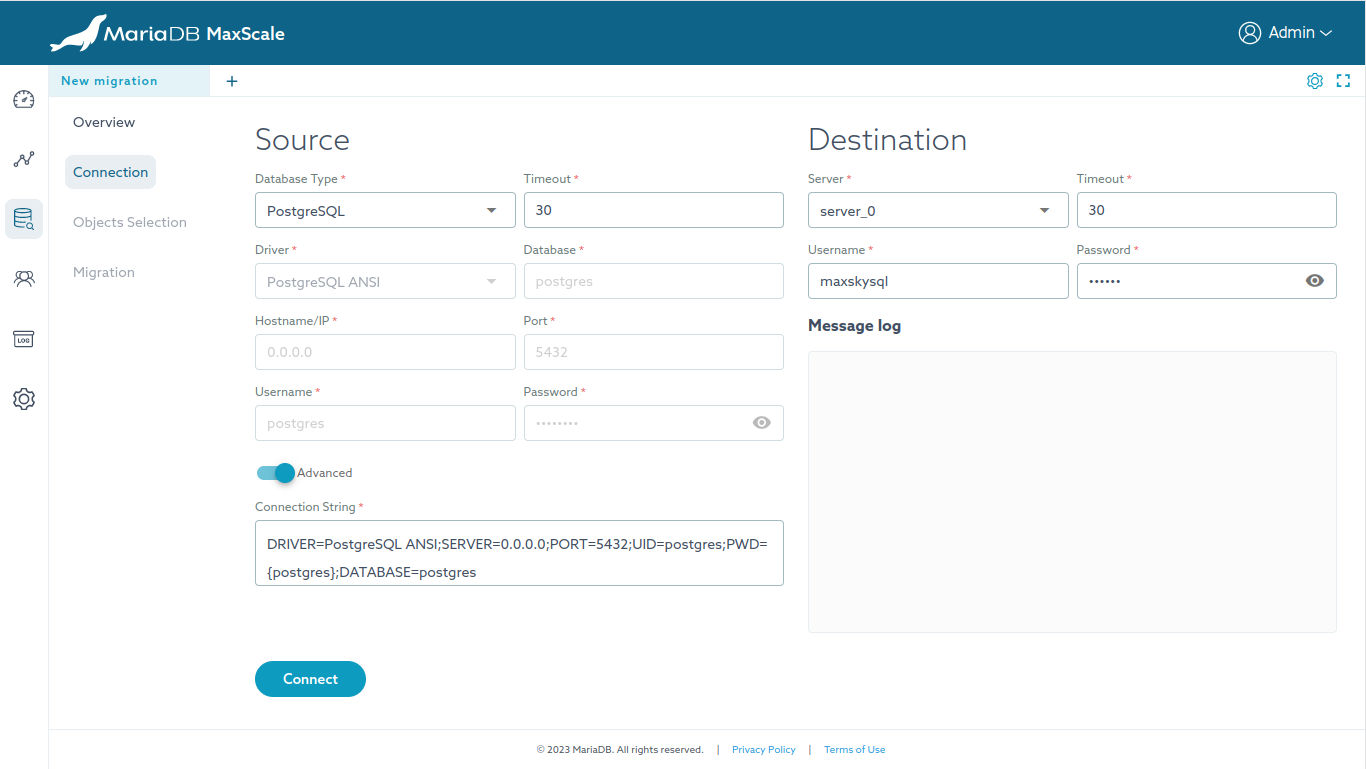
Source connection shows the most common parameter inputs for creating
an ODBC connection. For extra parameters, enable the Advanced mode
to manually edit the Connection String input.
After successfully connected to both source and destination servers,
click on the Select objects to migrate to navigate to the next stage.
Objects Selection
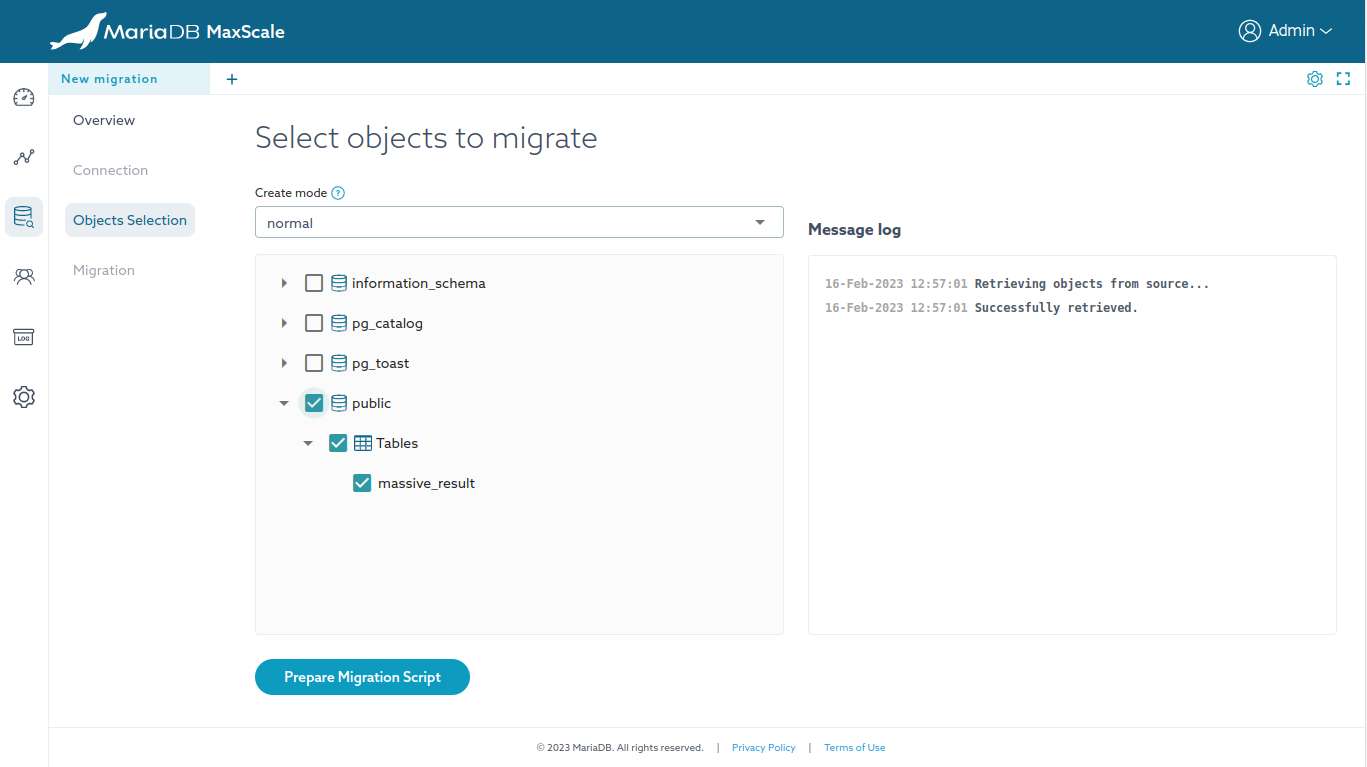
Select the objects you wish to migrate to the MariaDB server.
After selecting the desired objects, click on the Prepare Migration Script to
navigate to the next stage. The migration scripts will be generated
differently based on the value selected for the Create mode input. Hover over
the question icon for additional information on the modes.
Migration
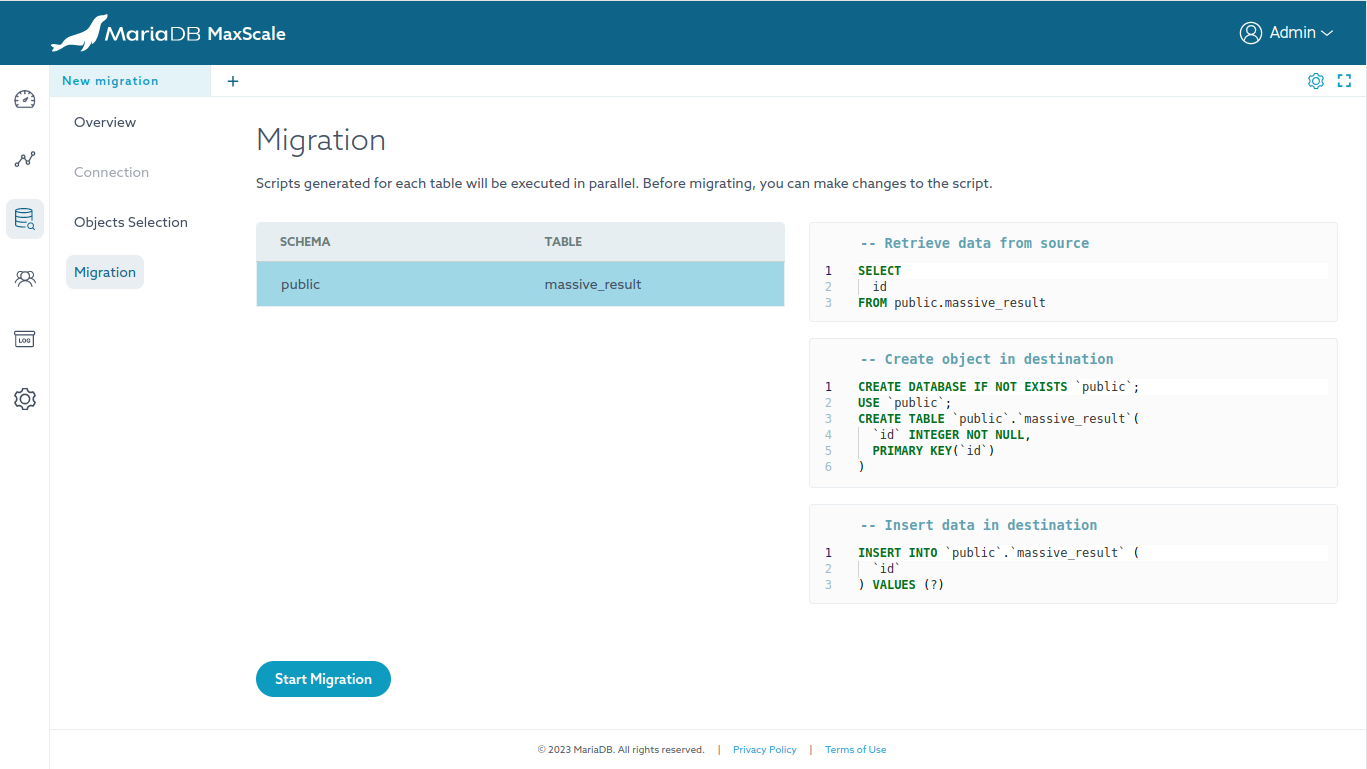
As shown in the screenshot, you can quickly modify the script for each object by selecting the corresponding object in the table and using the editors on the right-hand side to make any necessary changes.
After clicking the Start Migration button, the script for each object will be
executed in parallel.
Migration report
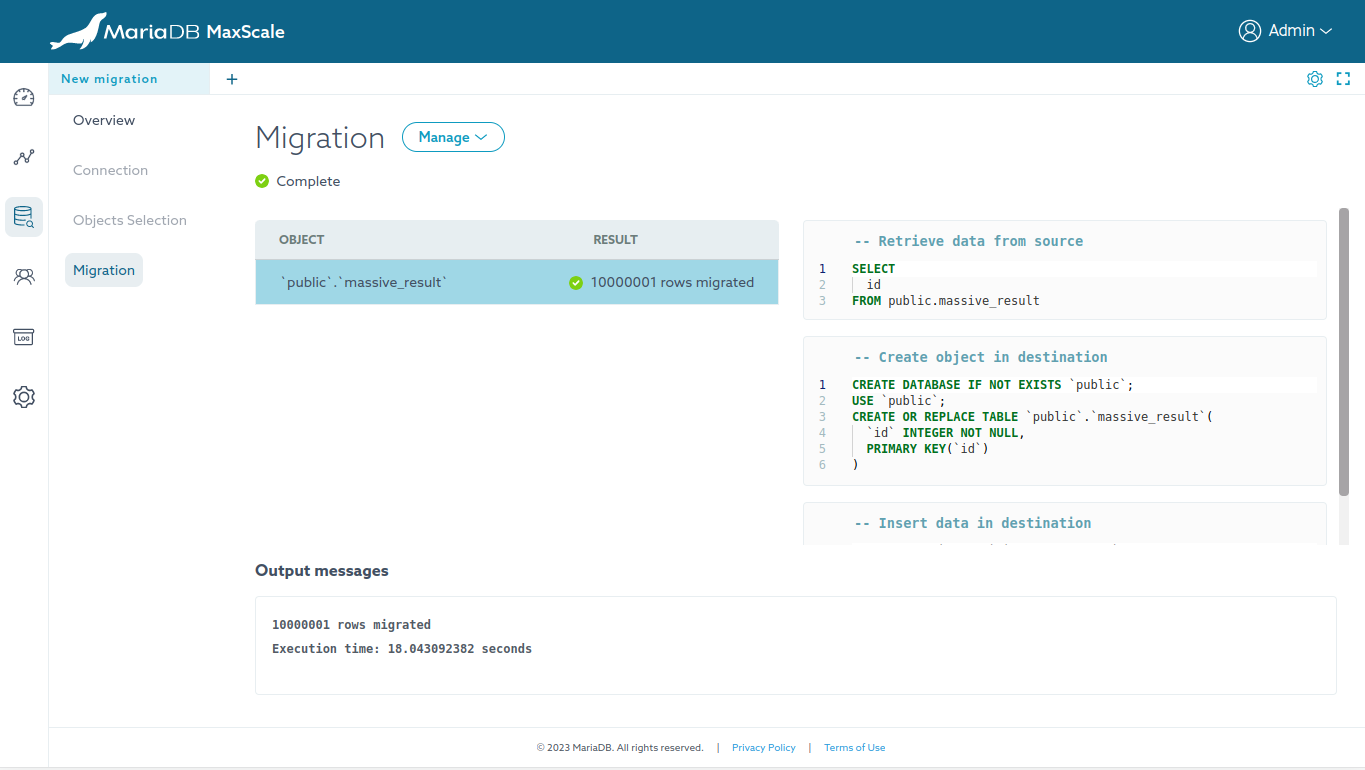
If errors are reported for certain objects, review the output messages and
adjust the script accordingly. Then, click the Manage button and select Restart.
To migrate additional objects, click the Manage button and select
Migrate other objects. Doing so will replace the current migration
report for the current object with a new one.
To retain the report and terminate open connections after migration, click the
Manage button, then select Disconnect, and finally delete the worksheet.
Deleting the worksheet will not delete the migration task. To clean-up
everything after migration, click the Manage button, then select
Delete.
Create an ERD
There are various features in the ERD worksheet, the most notable ones are listed below.
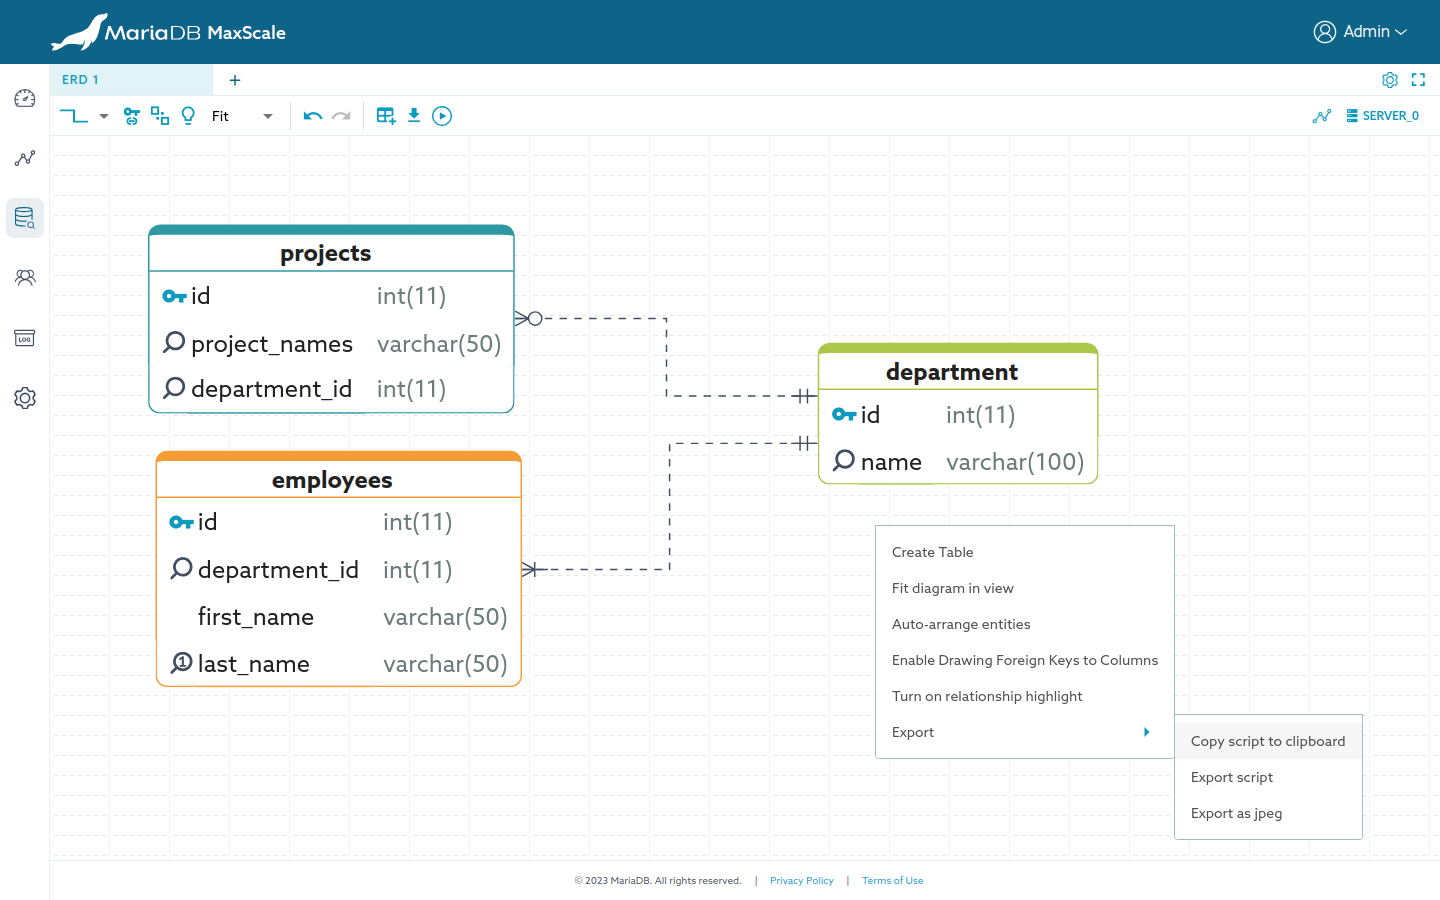
ERD worksheet
From an empty new worksheet, clicking on the "Create an ERD" card will open a connection dialog. After connecting successfully, the ERD worksheet will be rendered in the active worksheet. The connection is required to retrieve essential metadata, such as engines, character sets, and collation.
Generate an ERD from the existing databases
Click on the icon button featured as a line graph, located on the top toolbar next to the connection button. This will open a dialog for selecting the tables for the diagram.
Create a new ERD
New tables can be created by using either of the following methods:
- Click on the icon button that resembles a line graph, located on the top toolbar.
- Right-click on the diagram board and select the
Create Tableoption.
Entity options
Two options are available: Edit Table and Remove from Diagram. These
options can be accessed using either of the following methods:
- Right-click on the entity and choose the desired option.
- Hover over the entity, click the gear icon button, and select the desired option.
For quickly editing or viewing the table definitions, double-clicking on the entity. The entity editor will be shown at the bottom of the worksheet.
Foreign keys quick common options
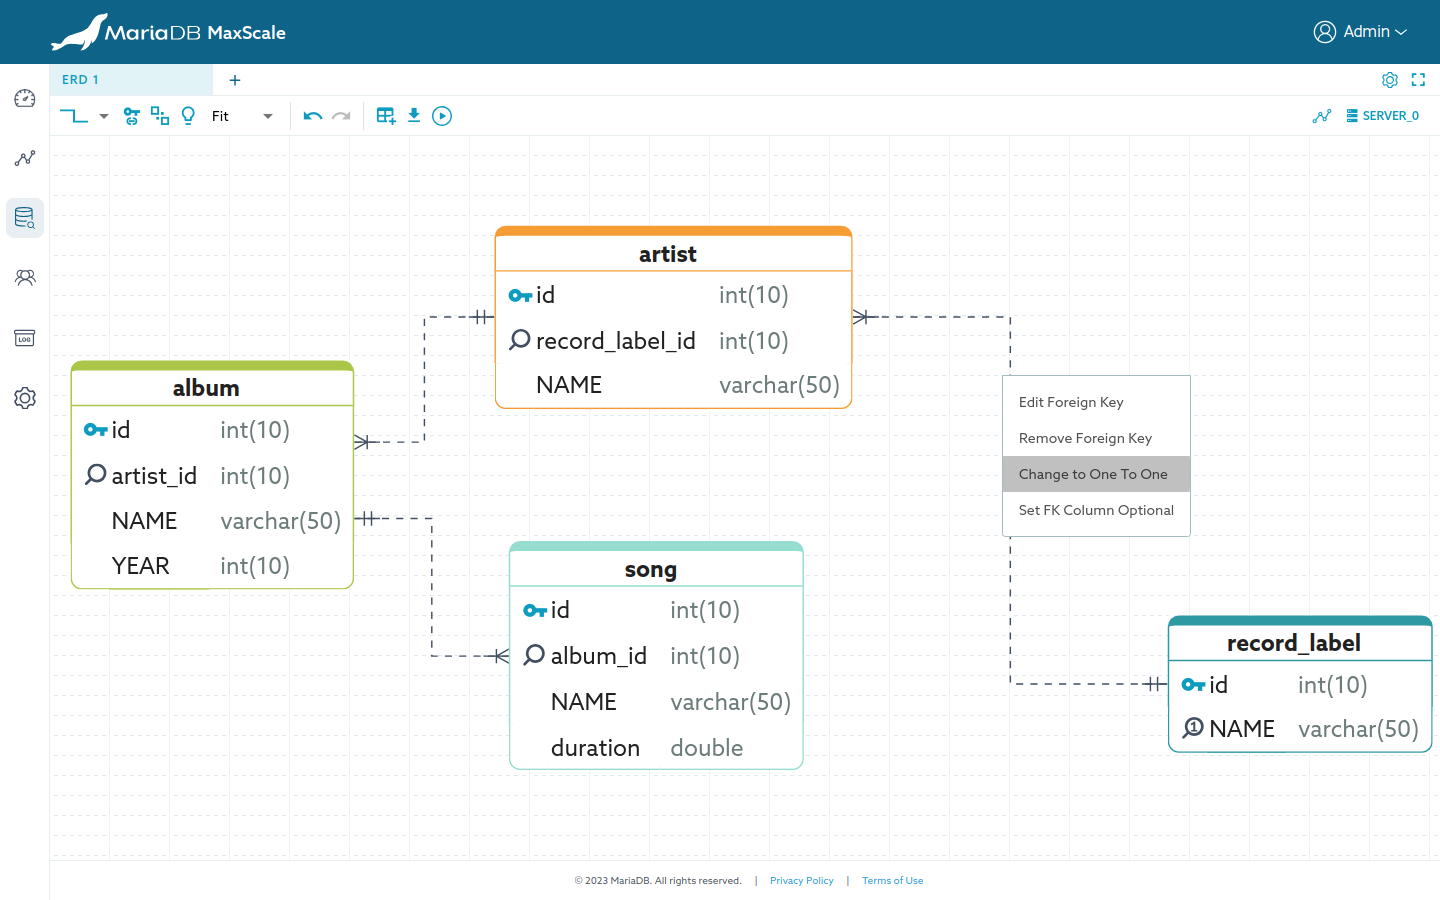
- Edit Foreign Key, this opens an editor for viewing/editing foreign keys.
- Remove Foreign Key.
Change to One To OneorChange to One To Many. Toggling the uniqueness of the foreign key column.Set FK Column MandatoryorSet FK Column Optional. Toggling theNOT NULLoption of the foreign key column.Set Referenced Column MandatoryorSet Referenced Column OptionalToggling theNOT NULLoption of the referenced column.
To show the above foreign key common options, perform a right-click on the link within the diagram.
Viewing foreign key constraint SQL
Hover over the link in the diagram, the constraint SQL of that foreign key will be shown in a tooltip.
Quickly draw a foreign key link
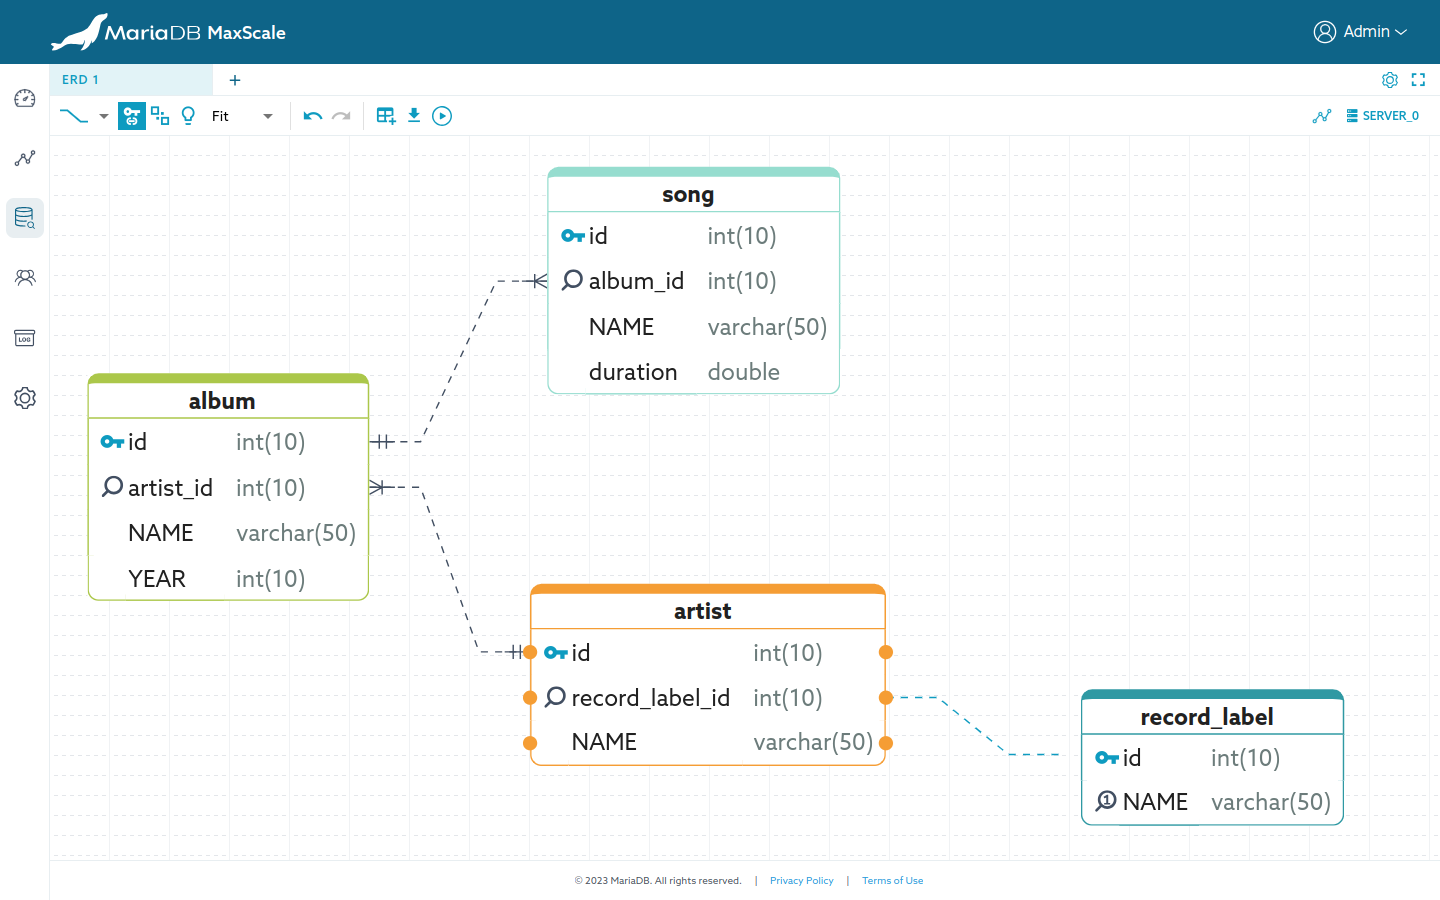
As shown in the screenshot, a foreign key can be quickly established by performing the following actions:
- Click on the entity that will have the foreign key.
- Click on the connecting point of the desired foreign key column and drag it over the desired referenced column.
Entity editor
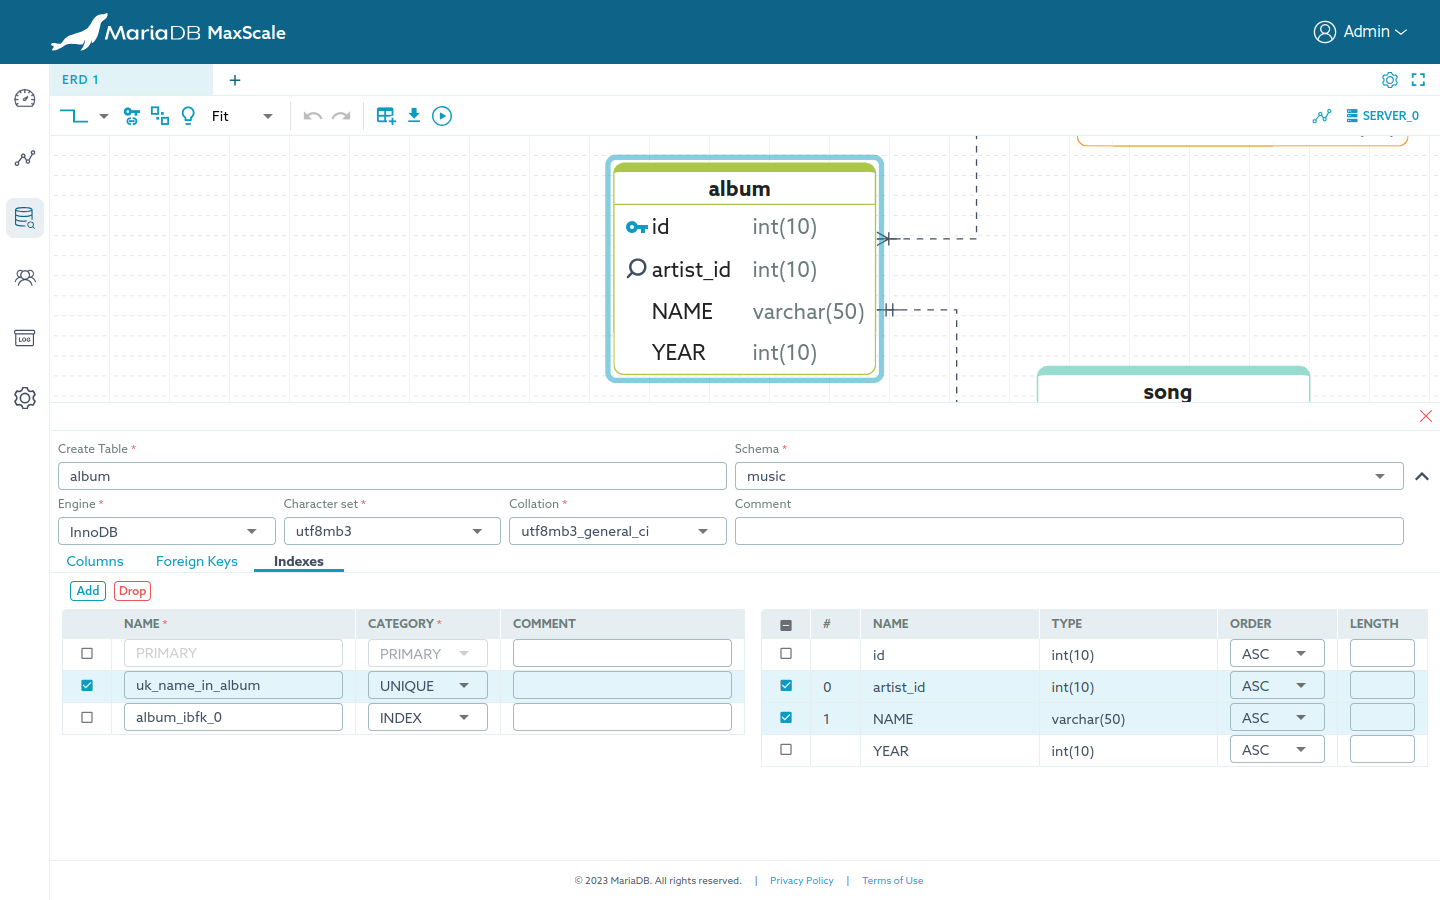
Table columns, foreign keys and indexes can be modified via the entity editor which can be accessed quickly by double-clicking on the entity.
Export options
Three options are available: Copy script to clipboard, Export script and
Export as jpeg. These options can be accessed using either of the following
methods:
- Right-click on the diagram board and choose the desired option.
- Click the export icon button, and select the desired option.
Applying the script
Click the icon button resembling a play icon to execute the generated script for all tables in the diagram. This action will prompt a confirmation dialog for script execution. If needed, the script can be manually edited using the editor within the dialog.
Visual Enhancement options
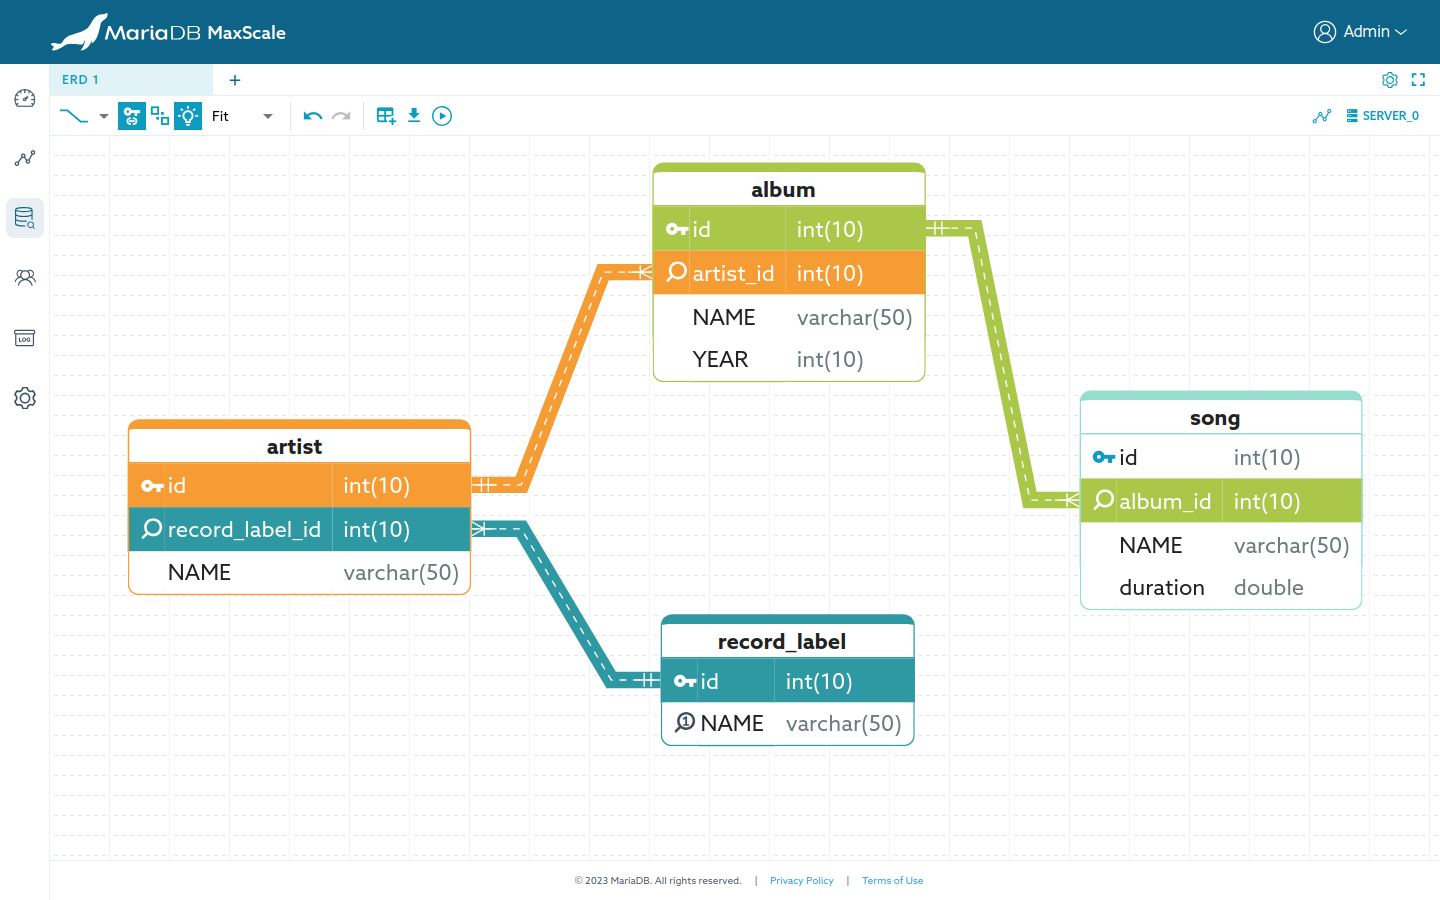
The first section of the top toolbar, there are options to improve the visual of the diagram as follows:
- Change the shape of links
- Drawing foreign keys to columns
- Auto-arrange entities
- Highlight relationship
- Zoom control

